This project has multiple visual representations available on my Portfolio.
Version 3 (2019 run): https://portfolio.owenthe.dev/trackeasterbunnycc
Version 4 (2020 run): https://portfolio.owenthe.dev/trackeasterbunnycc-version-4
track.easterbunny.cc is an ongoing long-term project to create the best Easter Bunny tracking experience on the internet. It is the successor to the Custom EBT made in 2018, and is my most involved, real-life project I’ve made.
WARNING! This is a highly detailed, technical read about track.easterbunny.cc. It’s over 10,000 words long (the longest article on this site), and will take a very long time to read!
Note: With a 10,000 word article comes some grammatical hiccups that I might not have spotted. If you do spot a grammatical issue in this article, comment on this article (or email me, my email is in the about page), tell me where it is, and I’ll fix it as soon as possible.
As with any of my posts, I constantly switch between I and we – usually to keep good flow in writing. For full clarification – I made most of the tracker, but got a lot of help from folks online with certain aspects of Version 4.
Introduction
track.easterbunny.cc gets its roots from the Custom EBT project in 2018. After livestreaming the NORAD & Google Santa Trackers in 2017, I was searching for an Easter Bunny tracker in 2018 for the live stream I was going to do. At first, it seemed like The CP Trackers was a good site to use. Unfortunately, it went offline, leaving Track Easter Bunny as the sole tracker to use.
I wasn’t a fan of Track Easter Bunny – the site went down frequently, had a bad design, and I wanted my own tracker. Using data from the web archive, I was able to create a lighter version of The CP Trackers using WordPress & Geo Mashup in about three weeks for private use.
Fast forward to December 2018 – I was starting to get more involved in web development, and preparations were starting for the 2019 Easter Bunny Tracker stream. At first, my plan was to upgrade my own tracker to have a moving map, pre-tracking, and lots of other features that had never been seen in the realm of Easter Bunny tracking. As development started, I decided to make the tracker public, with the URL track.easterbunny.cc.
Version 3 – 2019
In January 2019, track.easterbunny.cc officially started development.
Deciding on the tracker architecture
The most important thing off the bat was to decide the architecture of the tracker, and whether to make it client-side or server-side. Client-side was the obvious choice – you can’t crash. Not crashing became one of the tracker’s features, because Track Easter Bunny had a reputation to crash a lot.
The plan was simple. Load in the tracker once, and your browser does all the heavy lifting. I also only knew about JavaScript at the time, and had no knowledge in APIs, Flask, or any of that fun stuff. So it had to be client-side.
For comparison, Google’s tracker is client-side. NORAD’s tracker appears to be a mix of client/server-side.
Designing the tracker
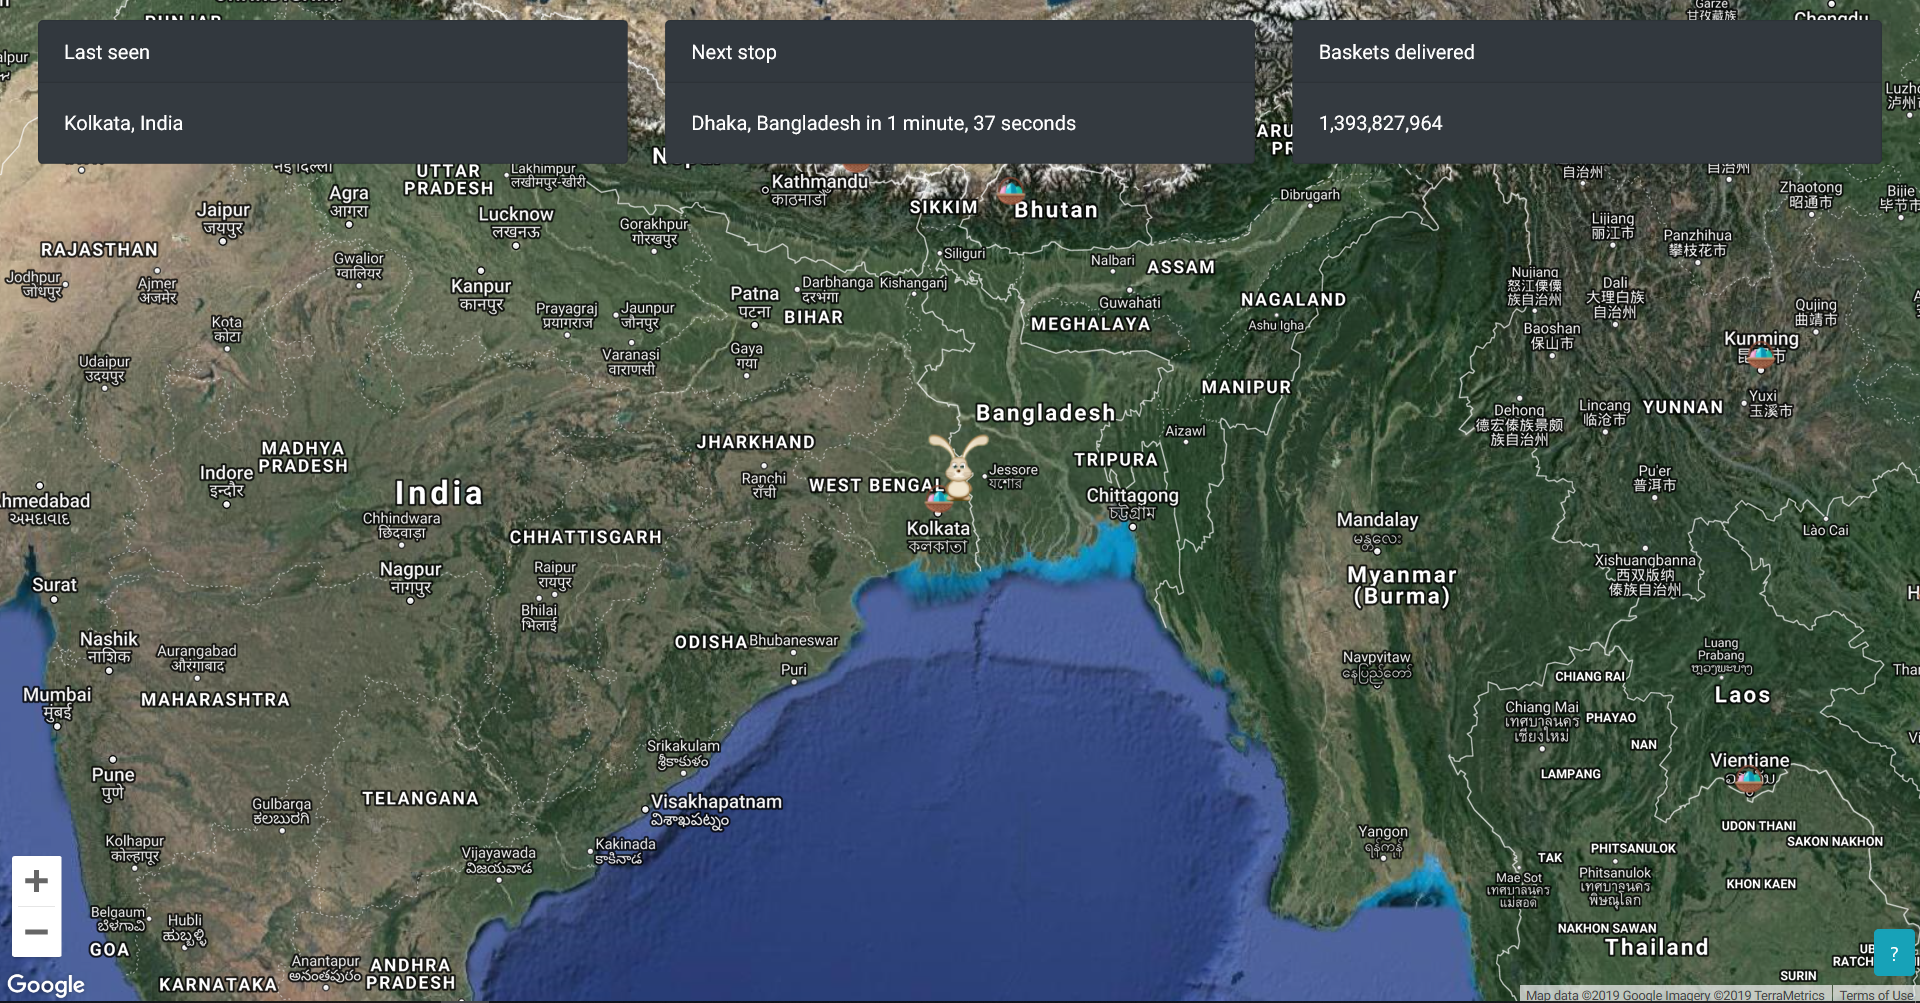
Using cues from Google’s and NORAD’s Santa Tracker, I decided on a three-box design with a Google Map underneath. It mixed what I liked about NORAD,

Prototype of track.easterbunny.cc on January 13, 2019
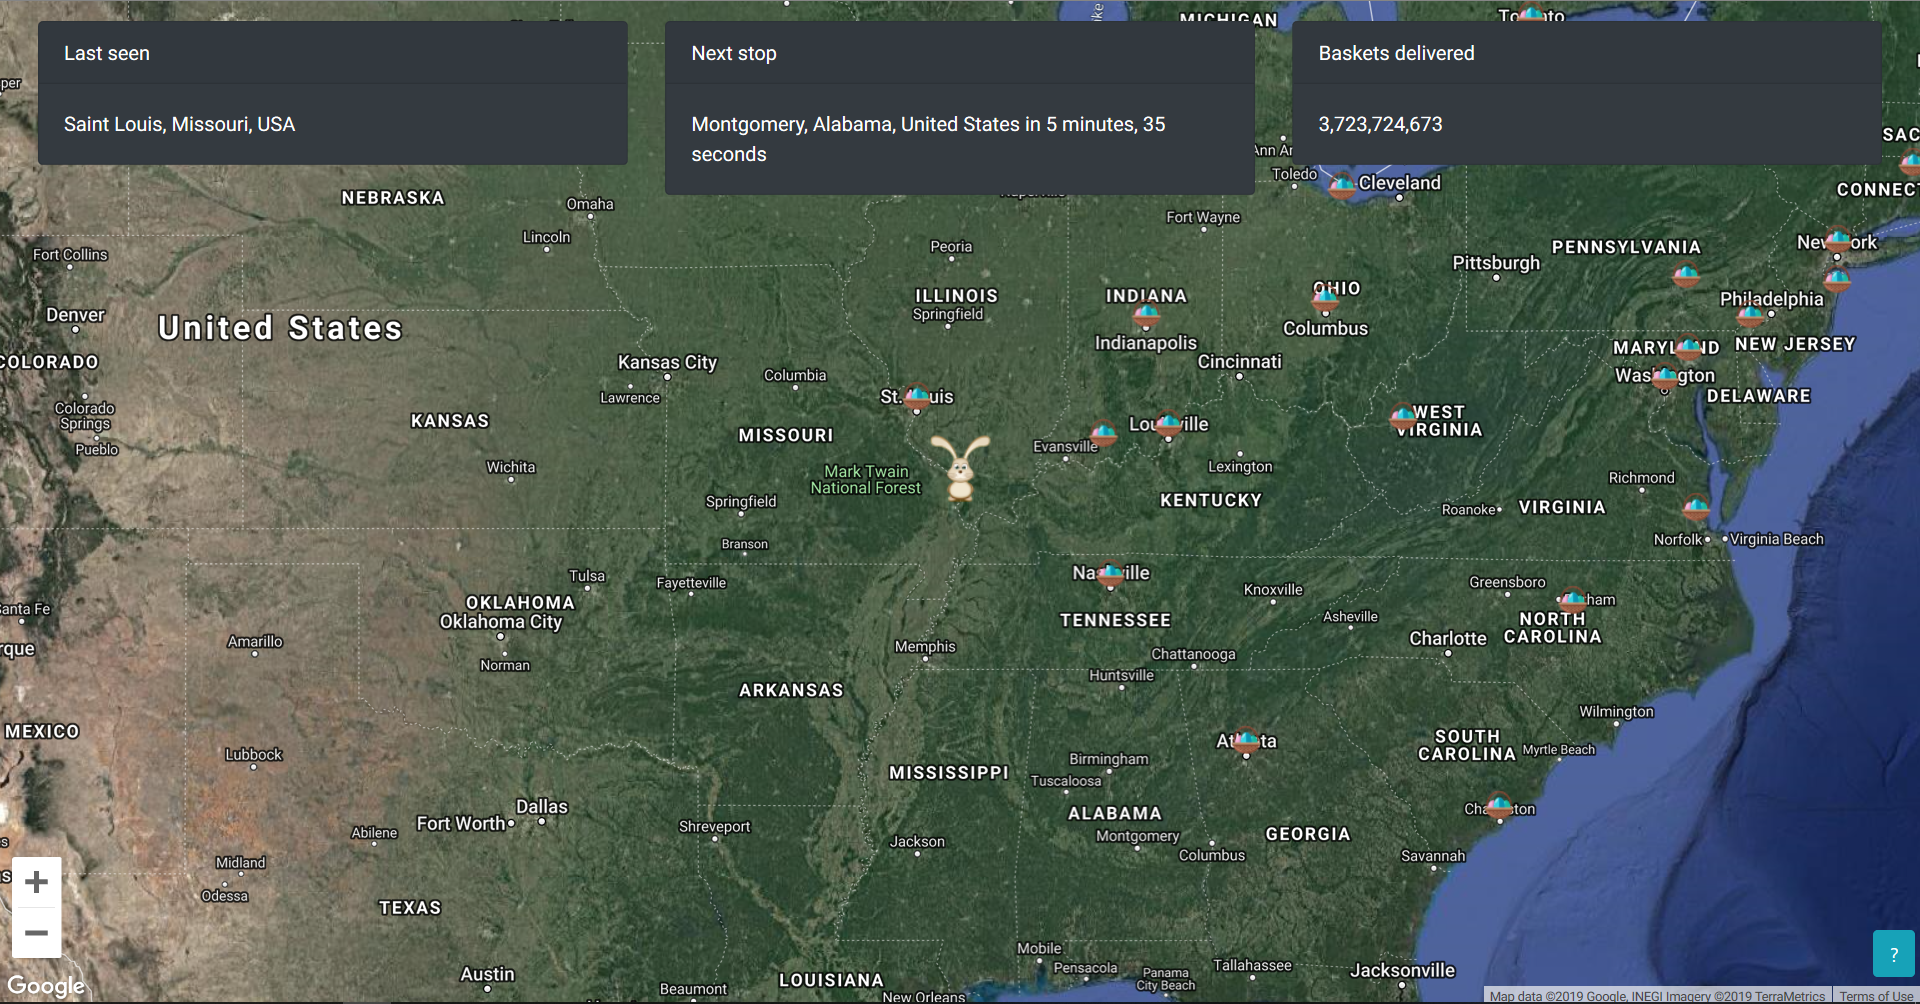
The three boxes used indicate Last seen, the Next Stop with a timer until the next stop, and the Baskets delivered count. The number of boxes that show up depend on the viewport size:
- Small (phone in portrait) – Show the Next Stop box
- Medium (small phone in landscape, portrait tablets) – Show the Next Stop & Baskets delivered boxes
- Large (desktops, landscape tablets & phones) – Show all boxes
Breakpoints are used so the boxes will automatically disappear when the viewport is too tiny. The order was decided based on how important each metric is. Next Stop is vital information, so it’s visible all the time. The baskets delivered count is a good metric to have as well, when there’s room. Finally, last seen is of course important, but not vital to the tracker.
Working with routing data
track.easterbunny.cc is entirely based on Unix timestamps – similar to how Google’s Santa Tracker works. The route file for track.easterbunny.cc is essentially a list of hundreds of stops, in order, with latitude & longitude information, along with what the baskets delivered count should be at the stop.
For the first year of tracking, we used Google Santa Tracker’s 2018 route, modifying it so that it starts & ends at Easter Island, and having the first hour of tracking start with New Zealand, then to Russia (in Santa Tracking, it’s the opposite of this). The entire route lasts for 25 hours, starting at 5 AM EDT Easter Eve, ending at 6 AM EDT Easter.
We also to use a derivative of Google’s route structure in a JSON format. The top key is destinations, with each stop having their own sub-key. I actually couldn’t figure out how to set up an list inside a JSON key, so each stop’s sub-key is their index as a string.
Included in each subkey is the latitude, longitude, baskets delivered count on arrival, and English name of the stop.
Since the tracker is linear (as in, the bunny marker moves the same for every update), we basically use point-slope to figure out where the bunny should be at any point. As a quick example:
If stop 20 is at 30.00 N, 30.00 W, and stop 21 is at 35.00 N, 32.00 W. We’re 30/60 seconds through the stop interval. We first calculate where it is on the latitude side of things using this equation: {(endlat – startlat) * (seconds since last stop / seconds of total interval)} + startlat. Same goes for longitude.
Crossing the international date line is an interesting technical blip
Since the tracker does cross the 180 degree longitude line, if the calculated longitude difference is over 200 (e.g, going to 179 W from -179 W, this results in a difference of 358 degrees), we subtract 360 from the difference (now -179 W -> 179 W produces the proper change, -2 degrees). The same thing applies in the other direction (as in, going to -179 W from 179 W would result in -358 degree difference, add 360 to it, now it’s 2 degrees of difference).
The catch here is that the Google Maps API will wrap longitude over/under 180 degrees. Setting the longitude to 181 degrees actually means the marker moves to -179 degrees. Setting the longitude to -181 degrees means the marker moves to 179 degrees.
If Google Maps didn’t have this safety net, we would add in code so that if the longitude is above 180 degrees, we’d subtract 360 degrees, and vice versa in the opposite direction.
Working with datarow counters
In addition to working with Unix timestamps, the tracker relies heavily on a data row counter, which indicates what index of the data function
The tracker also relies on a persistent “iteration” counter, which is the amount of seconds since the last stop occurred. Every 20ms, a function fires to update a global unrounded, and rounded iteration count. There are persistent functions that will update the duration until the next stop, baskets delivered, and the position of the marker – but there’s a trigger function that fires whenever the iteration count hits the number of seconds in the current stop interval, handled by the 20ms timer.
All of the tracker logic was developed at the same time the data import code was being added to the tracker, since the two go hand in hand. By the end of January, the tracker was in a functional prototype stage, and was able to move around the map during tracking.
setInterval doesn’t work when tabs are out of focus, we better fix that!
I noticed a huge issue during logic development with the tracker falling out of sync when it wasn’t on focus. This is due to browsers slowing timeouts & intervals when it isn’t in focus.
The solution? Creating a whole new function that gets the tracker up to speed when the page comes into and out of view. Thus, the vischange function was born. Vischange is triggered in a few ways – whenever a JavaScript listener for page focus is fired, and a sleep detection solution implemented from Stack Overflow.
Vischange does three big things. The first operation is to figure out where the bunny is in tracking, and if we need to increase the datarow further. There’s then two scenarios where we’re on the same datarow, or if the datarow has fallen out of sync. In the first scenario, we just update the bunny marker, baskets delivered count, and we’re back to tracking. In a second scenario where we’ve fallen out of sync, the vischange function basically “refreshes” the tracker, as if you just loaded it in – vischange is the “cousin” of the function that sets up the tracker on load.
Ending tracking gracefully
One of the final hurdles to overcome was handling the end of tracking gracefully. We wanted to emulate what NORAD does when tracking ends – pan the map out to the world so you can get some perspective of the entire journey. Most importantly, all the timers need to be stopped, and the Next stop box needed to be set to “the journey is over, thanks for tracking with us!”
We achieve this by having an if condition in trigger, before incrementing it by 1. If the datarow is the highest index in the route file, then run the special end of tracking code. The same logic also applies in vischange. If a user tabs out 6 hours before end of tracking, but tabs in once it’s done, the tracker will obviously be behind. Vischange “refreshes” the tracker, but also runs the end of tracking code.
Counting down to the big moment
Another thing we realized early on was we’d need a way to keep people out of the tracker before it started. The solution was pretty simple – a countdown page that just had a countdown. I got a lot of flack for this – but as it turned out, it was pretty awesome going from a simple countdown to a brand new tracking experience.
As with the tracker, there were issues with the countdown falling behind on tab in/out, so I made a special version of vischange for the tracker. Other than that, the countdown relies on a bunch of timeouts to redirect to tracking at the proper time.
Another fun issue – setTimeout’s timeout argument cannot exceed the 32-bit maximum integer. If it does, it wraps, so the countdown was magically going to the tracker months in advance. The solution was simple, if the seconds until the tracker starts is above 2 billion, have the countdown page redirect onto itself in 2 billion seconds. Edge cases are fun!
Pre-tracking – a fun challenge!
Pre-tracking is a concept NORAD pioneered in tracking. The basic gist is that their tracker starts 4 hours before liftoff, and shows Santa’s preparations up until liftoff. It lengthens the tracker runtime, and is more engaging. We wanted to do something similar to NORAD given our timeframe, so we decided to do 3 hours of pre-tracking from 2 AM EDT to 5 AM EDT Easter Eve.
Pre-tracking looked like this in its first iteration:

Prototype of pre-tracking: January 26, 2019
Pretty quickly, I realized this is a stupid UI design. Instead, we set the background to the Easter Bunny on Easter Island – but with the Google Maps API, so that it scaled for every device properly. The zoom level was set at 3 permanently, and you couldn’t move it around.
For pre-tracking, we had a separate route, but it followed the same structure as the main route. The difference, of course, is instead of latitude/longitude, it’s just an English message for the status update. The pre-tracking page was basically a stripped down version of the tracker, with code to just update the “Last seen” field.
Not shown in the image is the addition of a “Time until liftoff” box, which was calculated on an independent timer.
Just for some perspective – it’s been about a month since development started in this post. track.easterbunny.cc Version 3 development flew – and I was able to implement a lot of what you saw here with about 30-40 hours of coding. Of course, with such a new product is a bunch of
Testing!
With such new software comes a truckload of bugs, edge cases, and the need to do a ton of quality assurance to make sure everything works right. Finally, I had a reason to justify dozens of devices sitting in drawers.
Quality assurance got under way. And the bugs were crawling out of the tracker. Same with edge cases! I was extensively testing the tracker on all devices, even getting a spreadsheet to help me out. Because the tracker wasn’t super complex, I did about 1,000-2,000 QA tests on a good variety of devices.
Catching incompatible browsers – pretty important!
Something I realized pretty early into QA was that not every device works with the Google Maps API. I quickly found Bowser, a library to detect browsers, and did a bunch of testing to see what the minimum versions of Chrome, Firefox, and IE were to get the tracker working.
Another interesting quirk of development – I had to abide by the ES5 spec of JavaScript, rather than ES6. This didn’t prove to entirely be an issue in Version 3, but did complicate things in Version 4.
Infrastructure via Cloudflare
Later on in development, I decided I wanted to use Cloudflare to speed up the site globally, and take load off of my origin server. Aside from setting up page rules to make sure everything was cached, Cloudflare was pretty easy to set up. I don’t usually use Cloudflare in my projects, but this was a special case, and I wanted to make sure the tracker wouldn’t crash.
Track Easter Bunny, the tracker that dominated the market before this was made, had a history of crashing. It’s a WordPress site (like this one) relying on a SQL database. With no automatic refreshing, the load on the database was too much, so the site would go down for extended periods of time.
Final preparations
As February turned into March, I started focusing on final preparations for the tracker, and releasing it to the world. In the final weeks before release, work was focused on optimizing SEO for the website.
Another cool feature that came later in development as adding in support for adding the tracker to homescreen via manifest files. This works in Chrome, Firefox, and Safari when properly implemented, and allows a user to add the tracker to the homescreen (as any other website), but have it launch as it’s own “app”.
Launch day!
track.easterbunny.cc was launched to the world on March 16, 2019, just about a month before tracking began. I highlighted how the tracker was about speed, simplicity, no more refreshing (this truly was the first no-refreshing tracker), pre-tracking, modern design, privacy (Track Easter Bunny has an AWFUL privacy policy – FYI. I decided to not add in trackers or other crap because I value privacy), and mobile optimization.
Between launch & tracking, I continued to test and test the tracker, fixing bugs and adding in minor features aren’t important to this post.
4 months of work comes down to 28 hours
The title of this section is really interesting, because it sums up what developing a tracker is all about. Working tirelessly for 4 months straight on a product, and it gets 28 hours in the spotlight to work and run flawlessly.
The funny thing was on Easter weekend, I was away from home visiting a college. It was a fly-away – meaning I wouldn’t get home until Saturday evening. So, I had to remotely “launch” the tracker.
So, sitting in the bathroom in a hotel, at the strike of 2:00 AM EDT on April 20, 2019, the tracker went live. I also played the iCarly theme song during the final 5 seconds – now it’s just something I have to do.
And…nothing crashed! Because about 20-30 people were on the tracker in the transition from pre-tracking to tracking. It’s still impressive numbers for a tracker that just showed up out of nowhere, and was shared extensively via word of mouth.
Pre-tracking was very successful. We started 3 hours earlier than Track Easter Bunny. Huzzah!
The next test was at 5 AM, as another redirect was made from pre-tracking to tracking. And, with the sound of iCarly in the bathroom, the redirect happened, the bunny started moving, and a huge pressure had just came off of my shoulders. The tracker was working incredibly, and kicking ass.
The end to an amazing first year
As the day went on, the amount of hits for the tracker continued to increase. It passed 1,000 hits, which was incredible! 2,000 hits came later in the night, and 3,000 about 8 hours before tracking ended.
As the sun rose on April 21, and the Easter Bunny returned home to Easter Island, Con te Partio (time to say goodbye) played on my 2019 EBT stream, and I had synced it so the peak of the song would sync with the ending of the tracker.
At precisely 6:00:00 AM, the tracker had registered 3,660 hits, and I slammed shut my XPS 13 and threw it on the ground (pretty lightly and onto carpet). I had just made a fully featured web app, and it ran flawlessly.
To say I was over the moon about this is an understatement.
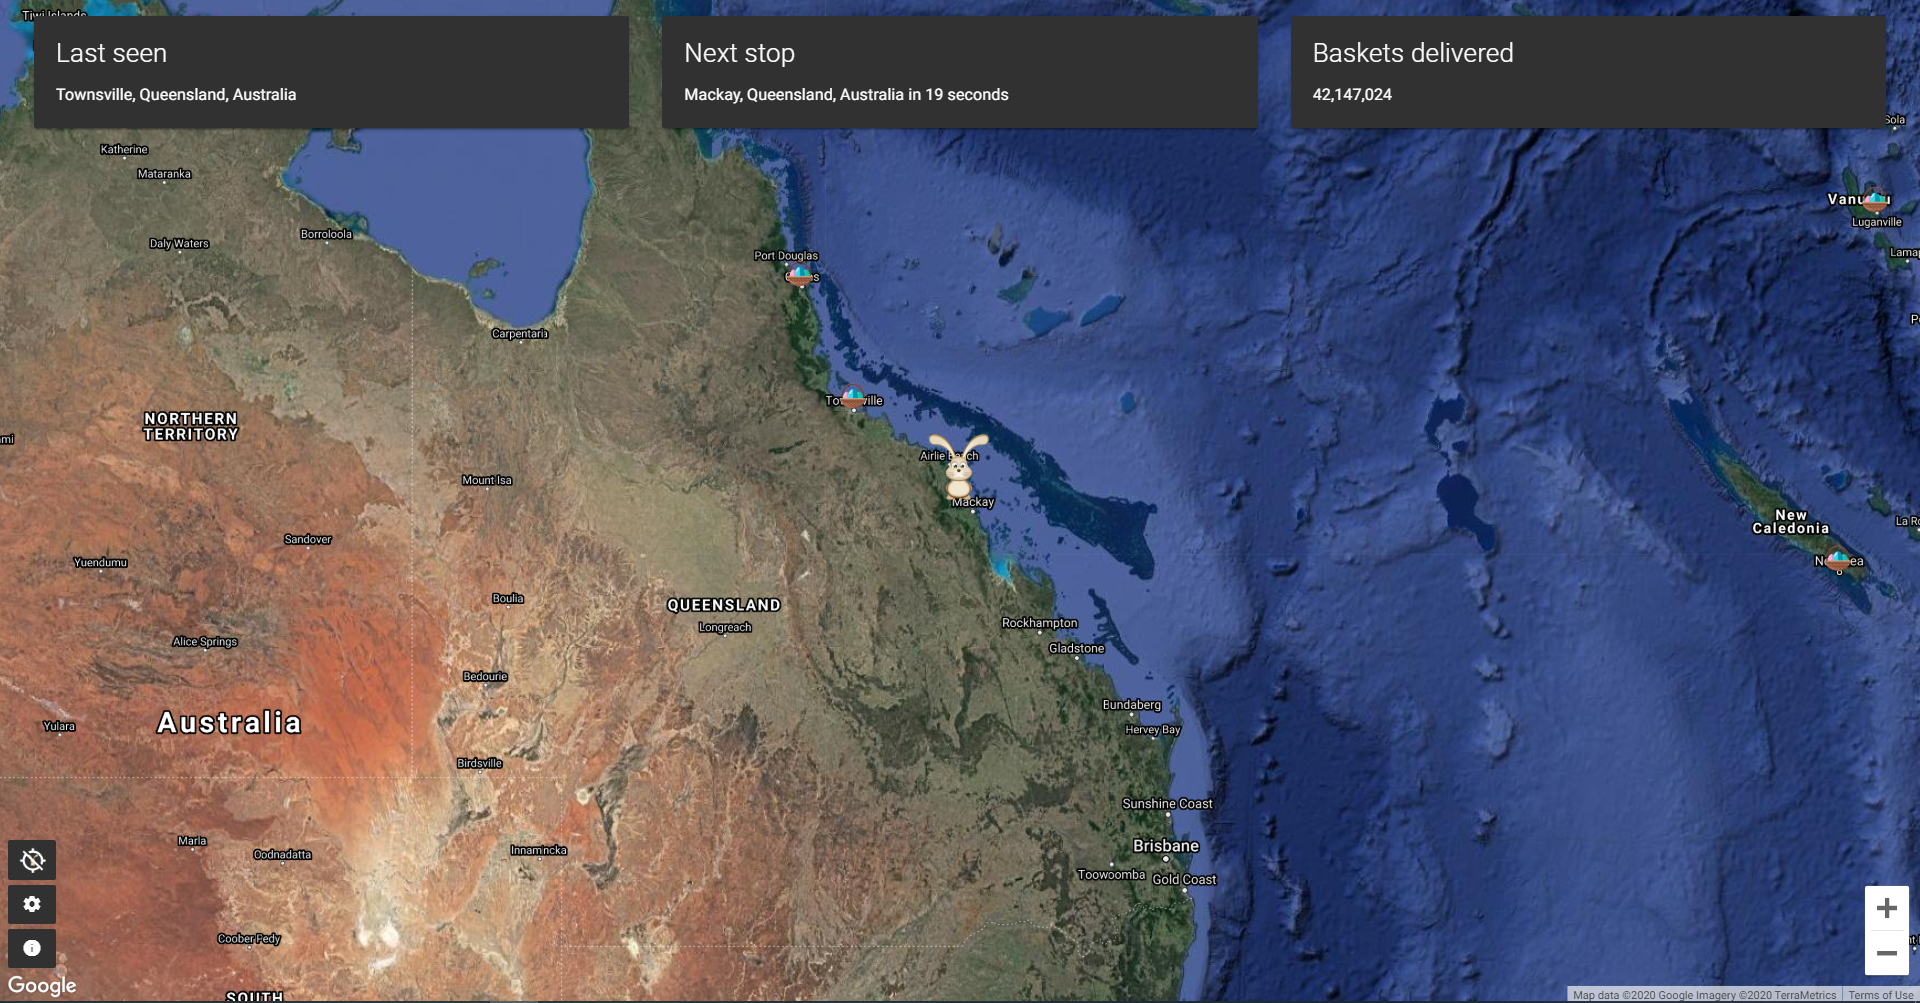
Screenshots from the 2019 run

Pre-tracking | 2:48 AM EDT, 4/20/2019
Start of tracking | 5:00 AM EDT, 4/20/2019

East Asia | 8:55 AM EDT, 4/20/2019
India & Middle East | 12:05 PM EDT, 4/20/2019

United Kingdom, Ireland & Europe | 8:25 PM EDT, 4/20/2019
United States of America | 12:45 AM EDT, 4/21/2019

End of tracking | 6:00 AM EDT, 4/21/2019
Prefer a timelapse? Here’s the timelapse for the 2019 run: https://www.youtube.com/watch?v=USLGaIxVU9c
With a successful 2019 behind us, it was time to think about…
Version 4 – 2020
After the 2019 run of track.easterbunny.cc ended, a lot of people were very impressed with track.easterbunny.cc. However, a lot of people said the tracker was too basic. And yep, that is indeed the case. Looking back, Version 3 was more-or-less a public proof-of-concept. The feature set was very basic, and I mainly wanted to focus on a lot of the underlying logic. Developing in this style did pay off for Version 4 of the tracker.
For Version 4, I focused on keeping the actual foundation of the tracker mostly the same, but instead building up the actual tracker. Version 4 was developed in a vastly different way compared to Version 3, with a lot of discrete features combining into a better tracking experience. That’s how this part of the writeup will be structured.
Development of track.easterbunny.cc Version 4 started around December 28, 2019.
Changing up the style
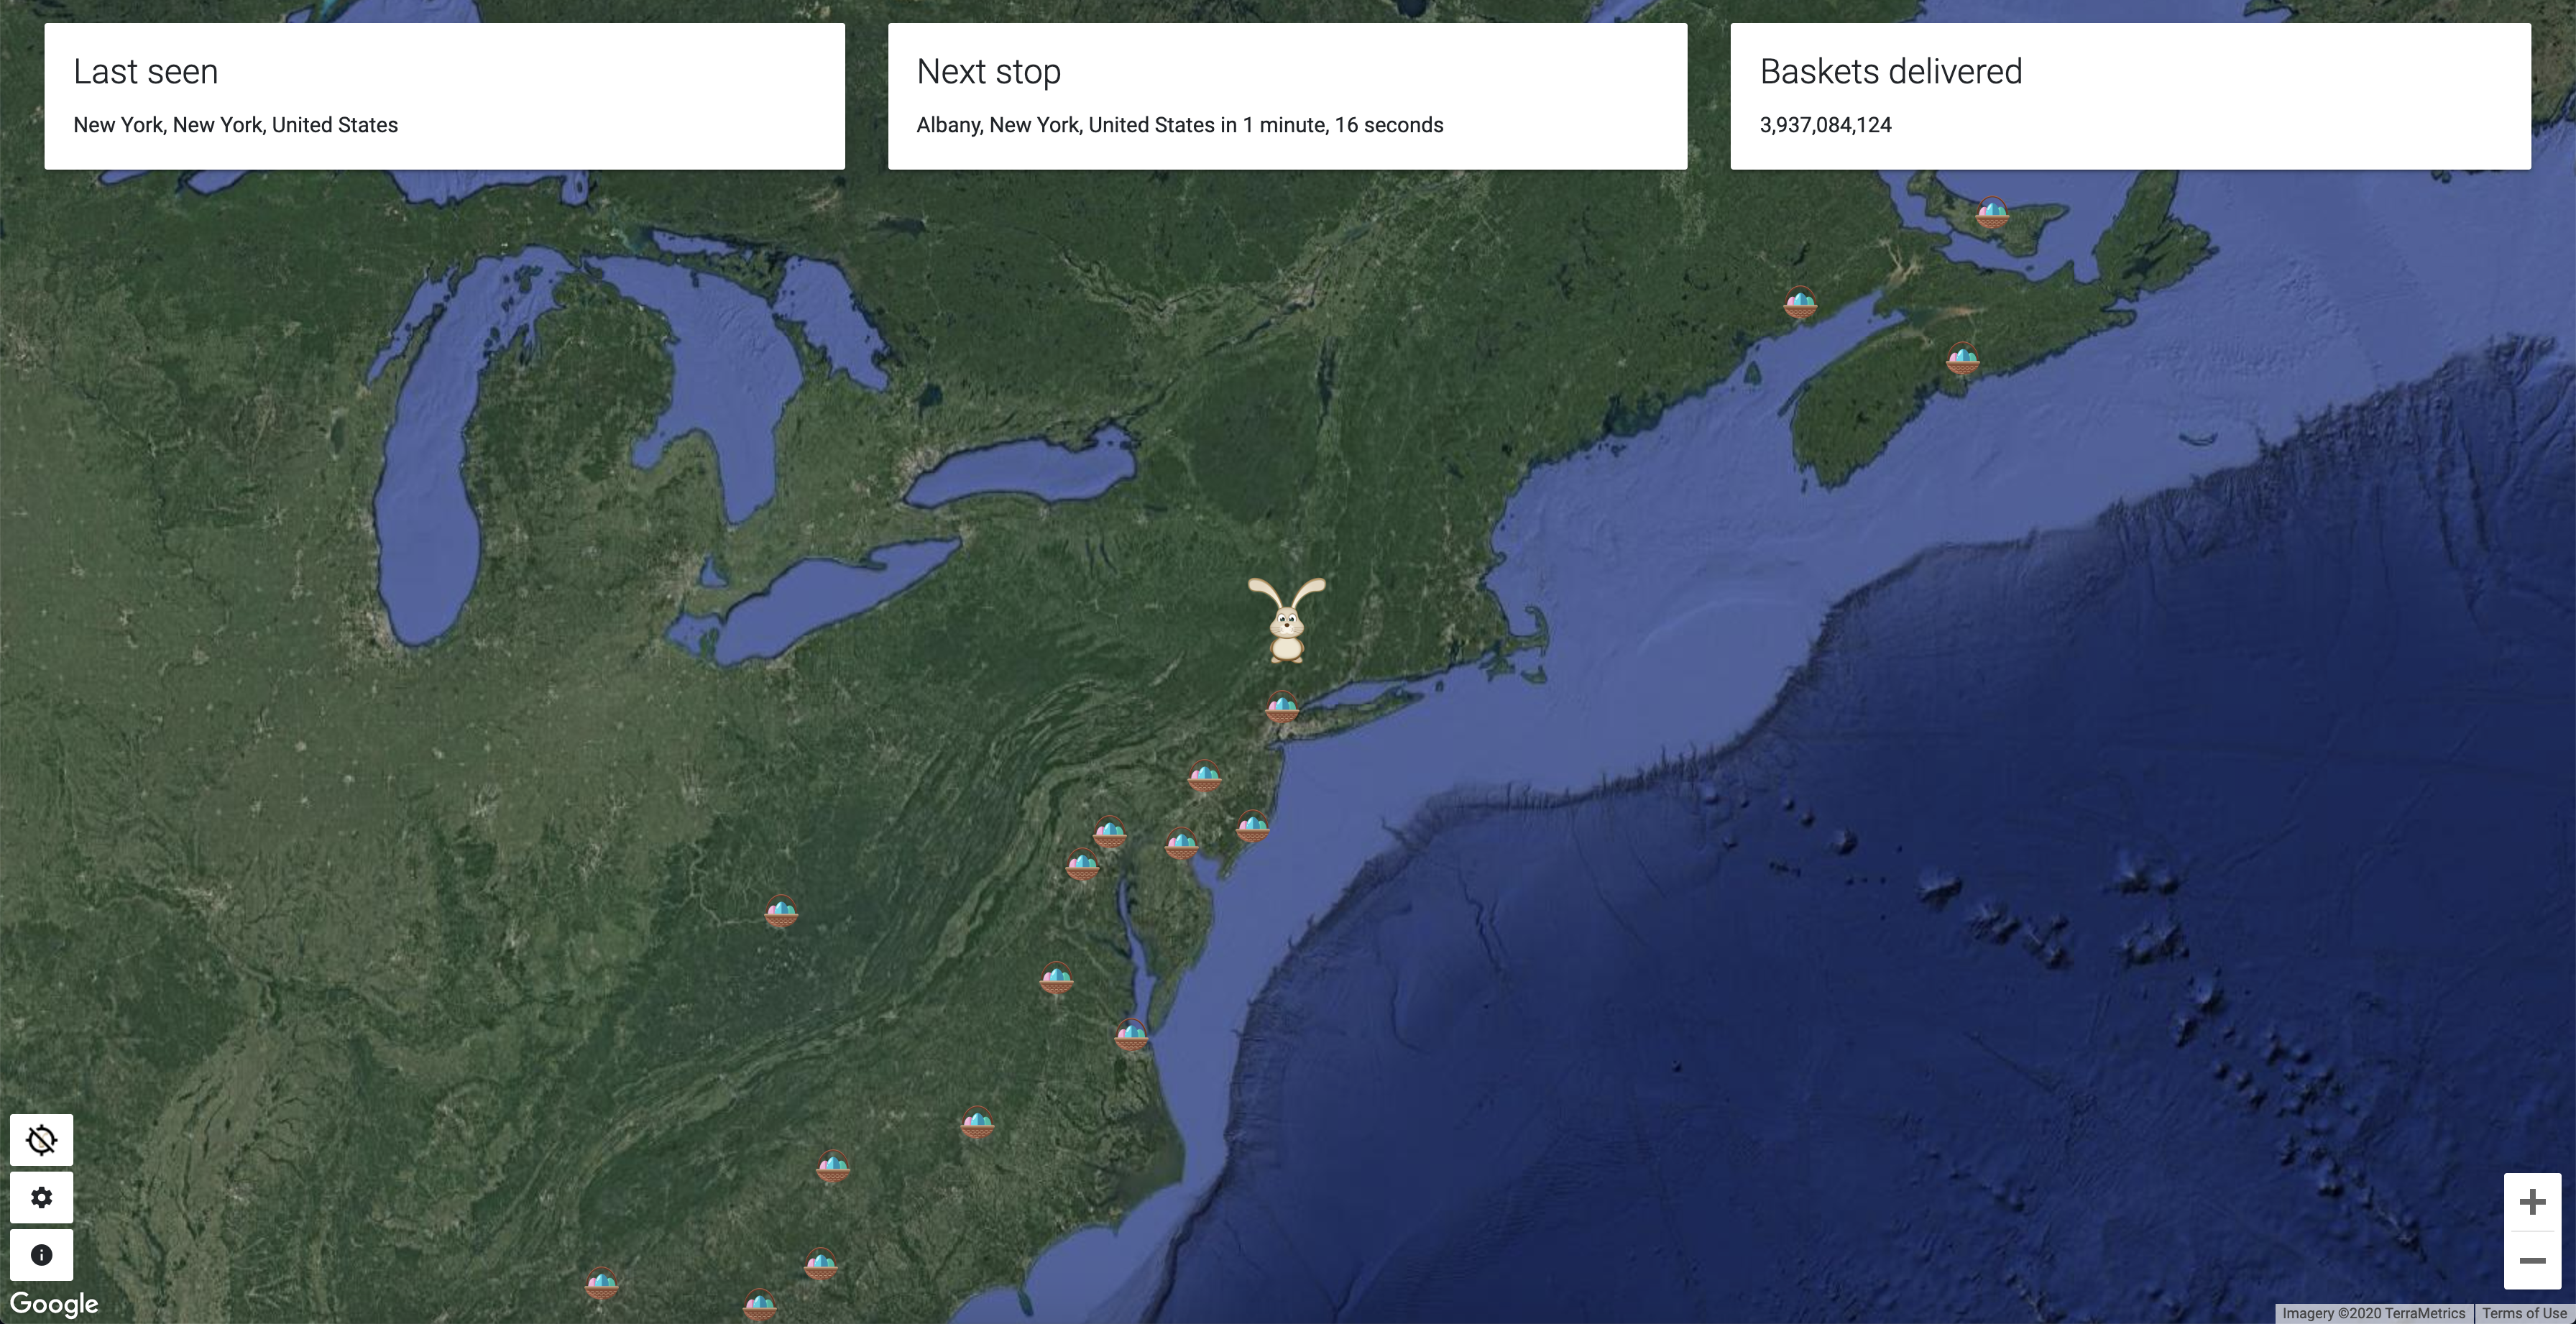
track.easterbunny.cc Version 3 looked miles better than any other tracker on the market, but was a little dated. To fix this, I decided to use Bootstrap Material Design.
I also took some time to implement more custom CSS on my end to give the tracker a unique flare, while also slimming it down. The end result was the top boxes didn’t look as clunky, and used vastly less space compared to Version 3.
The design of the tracker stayed pretty constant from the very early days of development right until the end – so most of the screenshots you’re seeing are from the final days of development.

New UI of the tracker on a desktop device

New UI of the tracker on a mobile device
Changing map zoom on mobile
About a month into development – I realized mobile devices didn’t get a ton of perspective on the map, at least to the same level as desktop users. I added a quick bit of code that sets the default zoom level to 5 just on mobile devices (versus 6 on all other devices). The screenshot (captured on a Pixel 3a) above shows how the map is zoomed out an additional level for more perspective.
For the main tracker control, we have a stack of 3 icons in the bottom left of the tracker. The bottom most icon launches an about window with information about how to use the tracker, as seen in this screenshot.

About window for the tracker
On the countdown page, the about window shows the liftoff times (localized in the users timezone, using a similar method as described in the extended stop data portion of this page), along with how to use the settings button.
The middle button is the settings button – which launches the settings window. Screenshots are coming in the next section!
The top button is to control if the map is centered or uncentered on the Easter Bunny. This button only appears during tracking (map is locked in pre-tracking, and is always uncentered after tracking).
Tracker customization
One of the more unique features of Version 4 was the addition of a settings window for the tracker, where you could customize a ton of settings with the tracker.
The UI for the settings window is just a modal with a tablist inside. There’s tabs for tracker settings, map settings, and ones for resetting the settings to defaults, or settings optimized for livestreaming the tracker online.

Tracker settings portion

Map settings portion

Advanced settings portion, which is home to the URL arguments feature. I developed a syntax checker so people could know if they got the arguments right or wrong.

Reset settings portion, which has buttons to reset settings to stream optimized and defaults. When clicking on these buttons, another modal appears to confirm the settings reset.
Storing user settings
To store settings, I decided on using the Local Storage API. It’s reliable, easy to implement and work with, and overall doesn’t cause a lot of pain. I did have to add in error catching to pick up when local storage is unavailable (which can happen, but it’s pretty rare).
To interact with settings, the tracker creates a local variable representing the contents of what’s in local storage, rather than having to constantly query the local storage API. Whenever the settings are changed, a function is called that updates the local storage (if it’s available), but also update the local variable. This allowed for tracker customization even when local storage is unavailable.
In the early days of Version 4, you had to click a save settings button after changing them. This was quickly changed so once a setting is changed, everything is saved on the fly. It’s much more natural, and less clunky.
For reset & stream optimized settings, separate functions are called that mostly do the same things as the function that changes all the settings around.
Change up those map modes – because you can do that!
Version 3 of the tracker only allowed hybrid mode, because there was no customization. I added in full support to change the map mode in Version 4, which was pretty simple to do. The Google Maps API allows you to change the map mode after load, so no issues there.
Same thing with getting the right map style when the map is initialized – it was a bit of a challenge to implement, but nothing crazy.

Street map mode
Satellite map mode

Hybrid map mode
It’s getting dark in here…did someone turn off the lights?
track.easterbunny.cc Version 3 was a hybrid of light and dark mode that didn’t make sense. The countdown was very much in light mode, but then the tracker was in dark mode – so there wasn’t a ton of unification going on. To fix this, one of the first features was to add full dark mode to the tracker.
The first step was creating light & dark mode stylesheets. I was able to use the colors from one of the theme presets in material dark mode, and apply them to certain elements using a global “topcard” class.
Around when I started working on dark mode, I realized Google Maps had the ability to set styles! Hybrid & satellite mode looked good in both light & dark mode (and honestly, you can’t change the color of the Earth), but dark mode with a light street map just doesn’t fly.
I took some time to set up a map style for dark mode, while also making customizations to ensure POI’s are hidden, along with a bunch of other smaller stuff. I also had to make sure it matched the light mode style, as having different levels of detail in light or dark mode doesn’t fly.
Within the first two days of starting Version 4 development, we had light and dark mode working – but with a catch. It relied on the preferedcolorscheme CSS variable, so dark mode only worked on modern devices. You couldn’t manually set light/dark mode, and this is where things got interesting.
A light switch is necessary
As mentioned earlier, I was limited to using ES5, so I couldn’t take advantage of CSS variables and had to take a very alternate route. In the early days, I decided to use jQuery’s ability to set CSS settings on the elements that needed a change of color. I also discovered that this implementation was absolute crap. Two main issues.
Issue 1 is that everything is hardcoded, and not linked to a stylesheet. If, at any point, I wanted to change the color of whatever I was setting, 20 minutes of find and replace would have to do. Issue 2 is that jQuery cannot interact with CSS states, which was a major issue with the dark mode implementation. In short, buttons were the right color, until hover over, and it’s not!
I seriously thought about entirely scrapping the feature, until I found you can disable & enable whole stylesheets in HTML, and then control it in jQuery. After this, everything was pretty much smooth sailing.
Automatic dark mode
Getting automatic dark mode to work was easy enough, but did require implementing it not the usual way because ES5. There’s a variable called pcs_raw that matches prefercolorscheme, and then we tack on a listener that listens for any changes. Code runs to change styles based on how the browser looks, and that’s all there is to automatic dark mode.
At the end of the day, the light & dark styles both look really great. The dark mode map also looks super nice, but I think next year, we’ll add a hint of blue for better readability.
Light mode
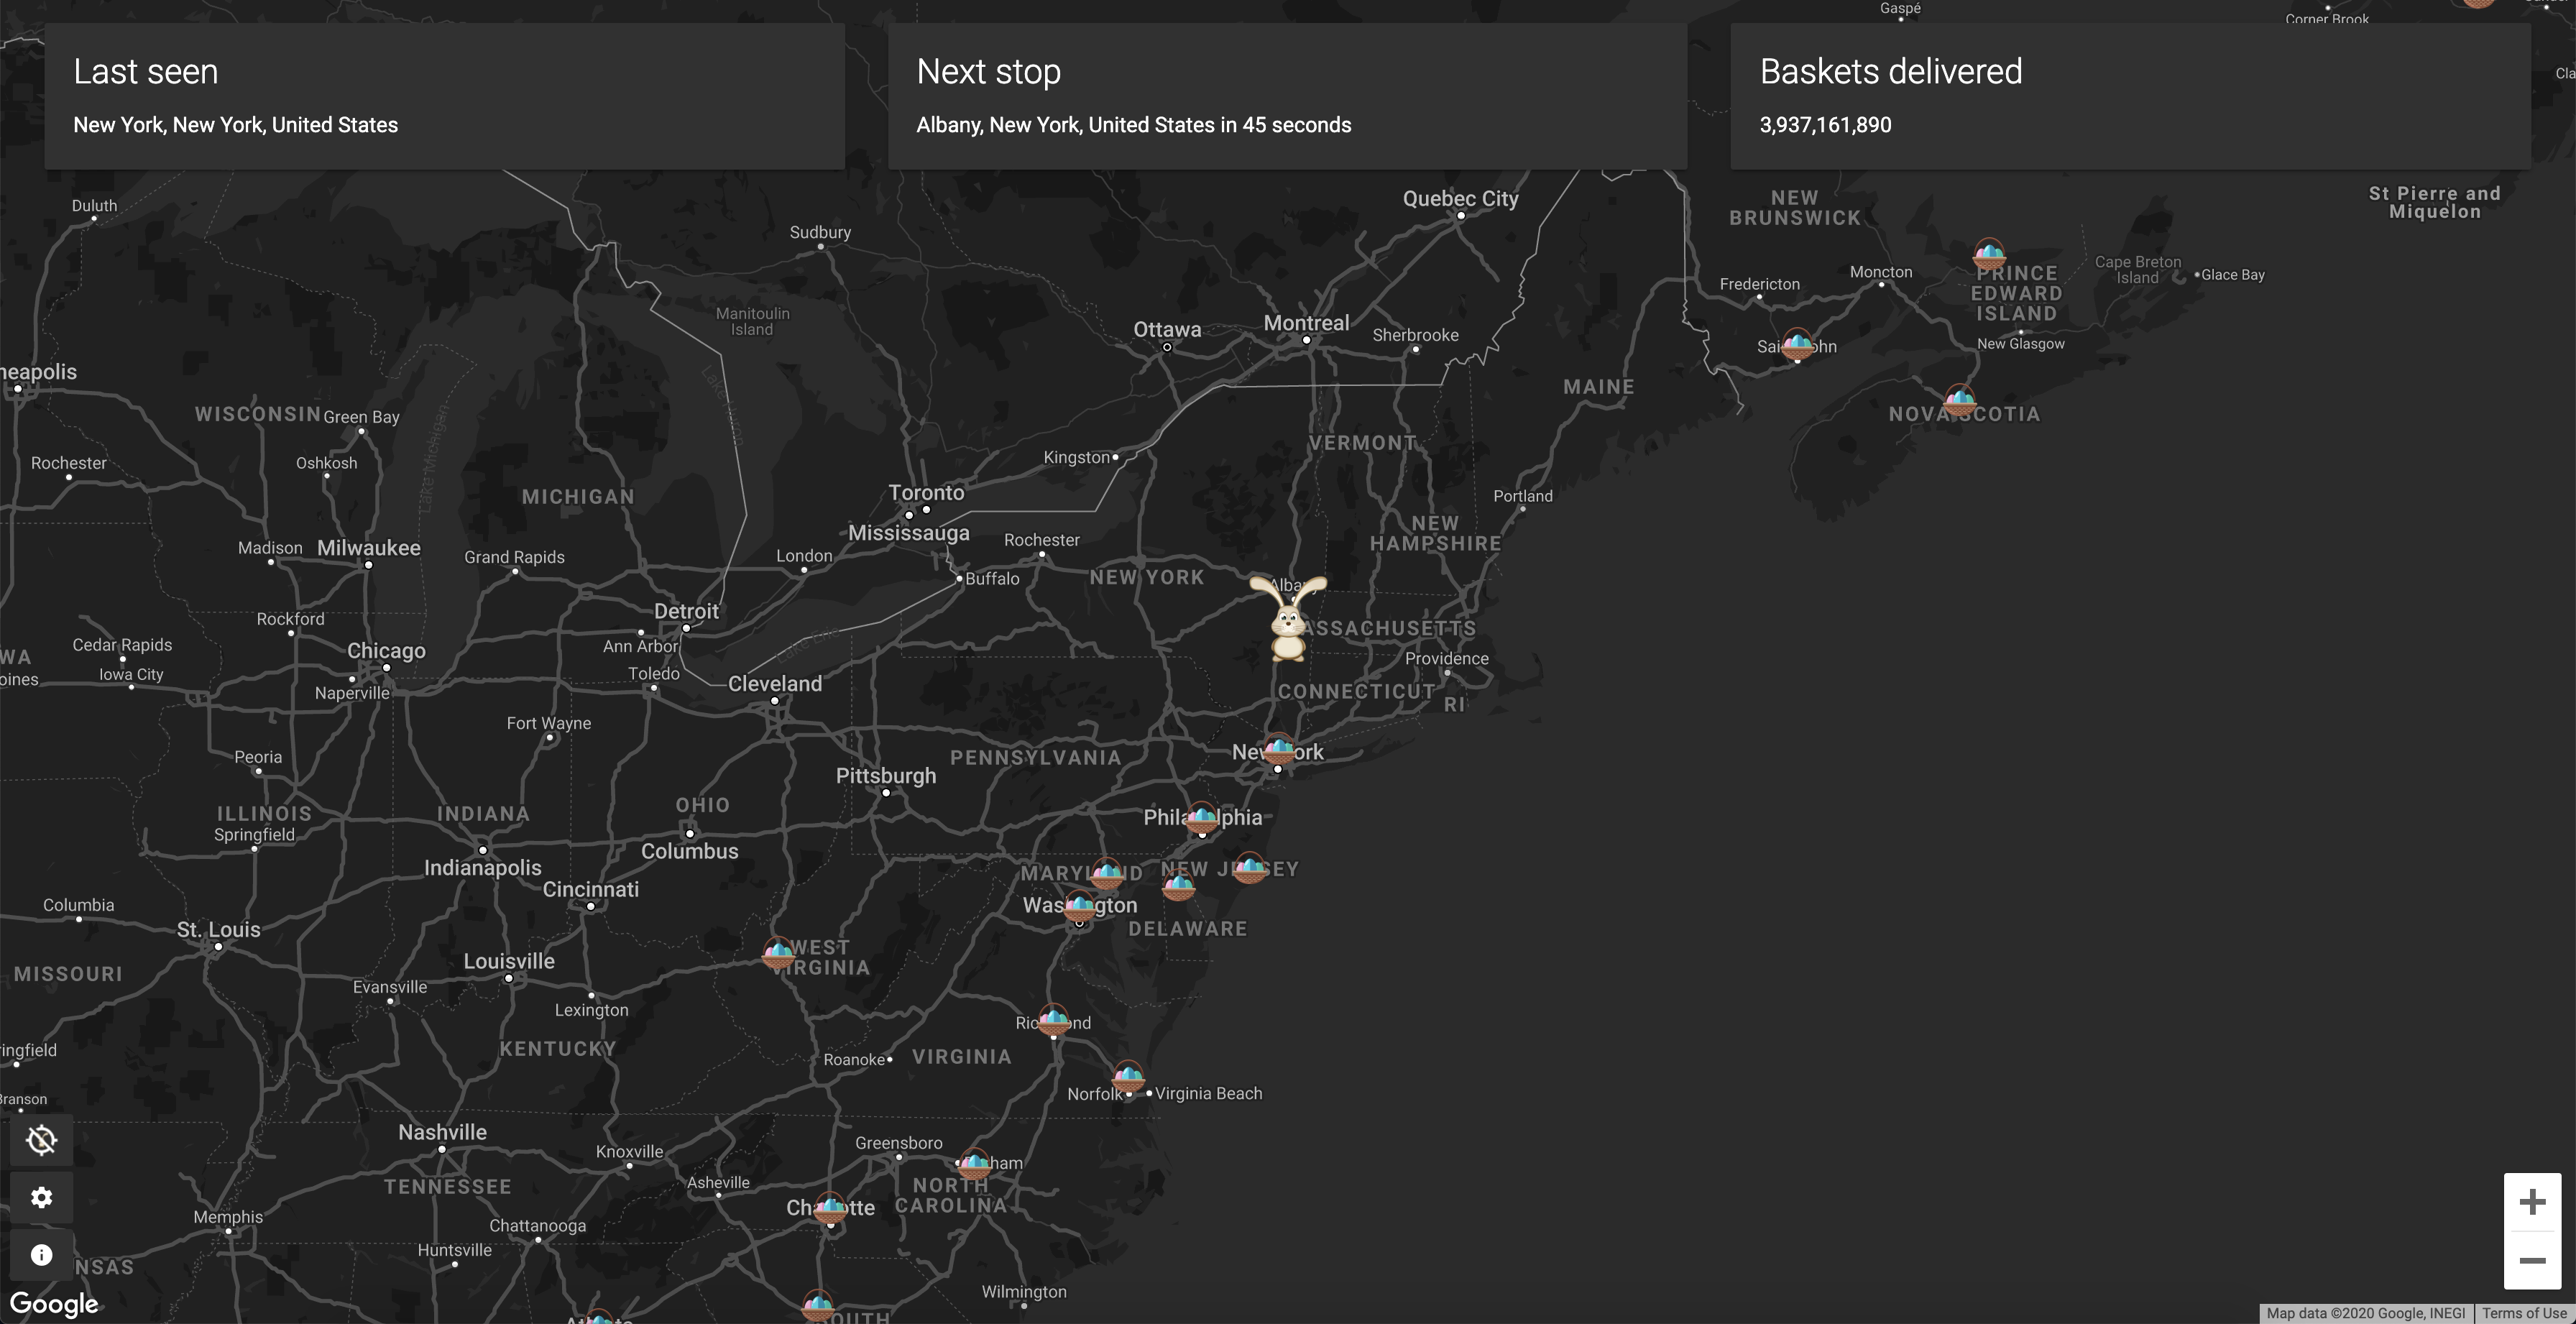
Dark mode
Estimated arrival time
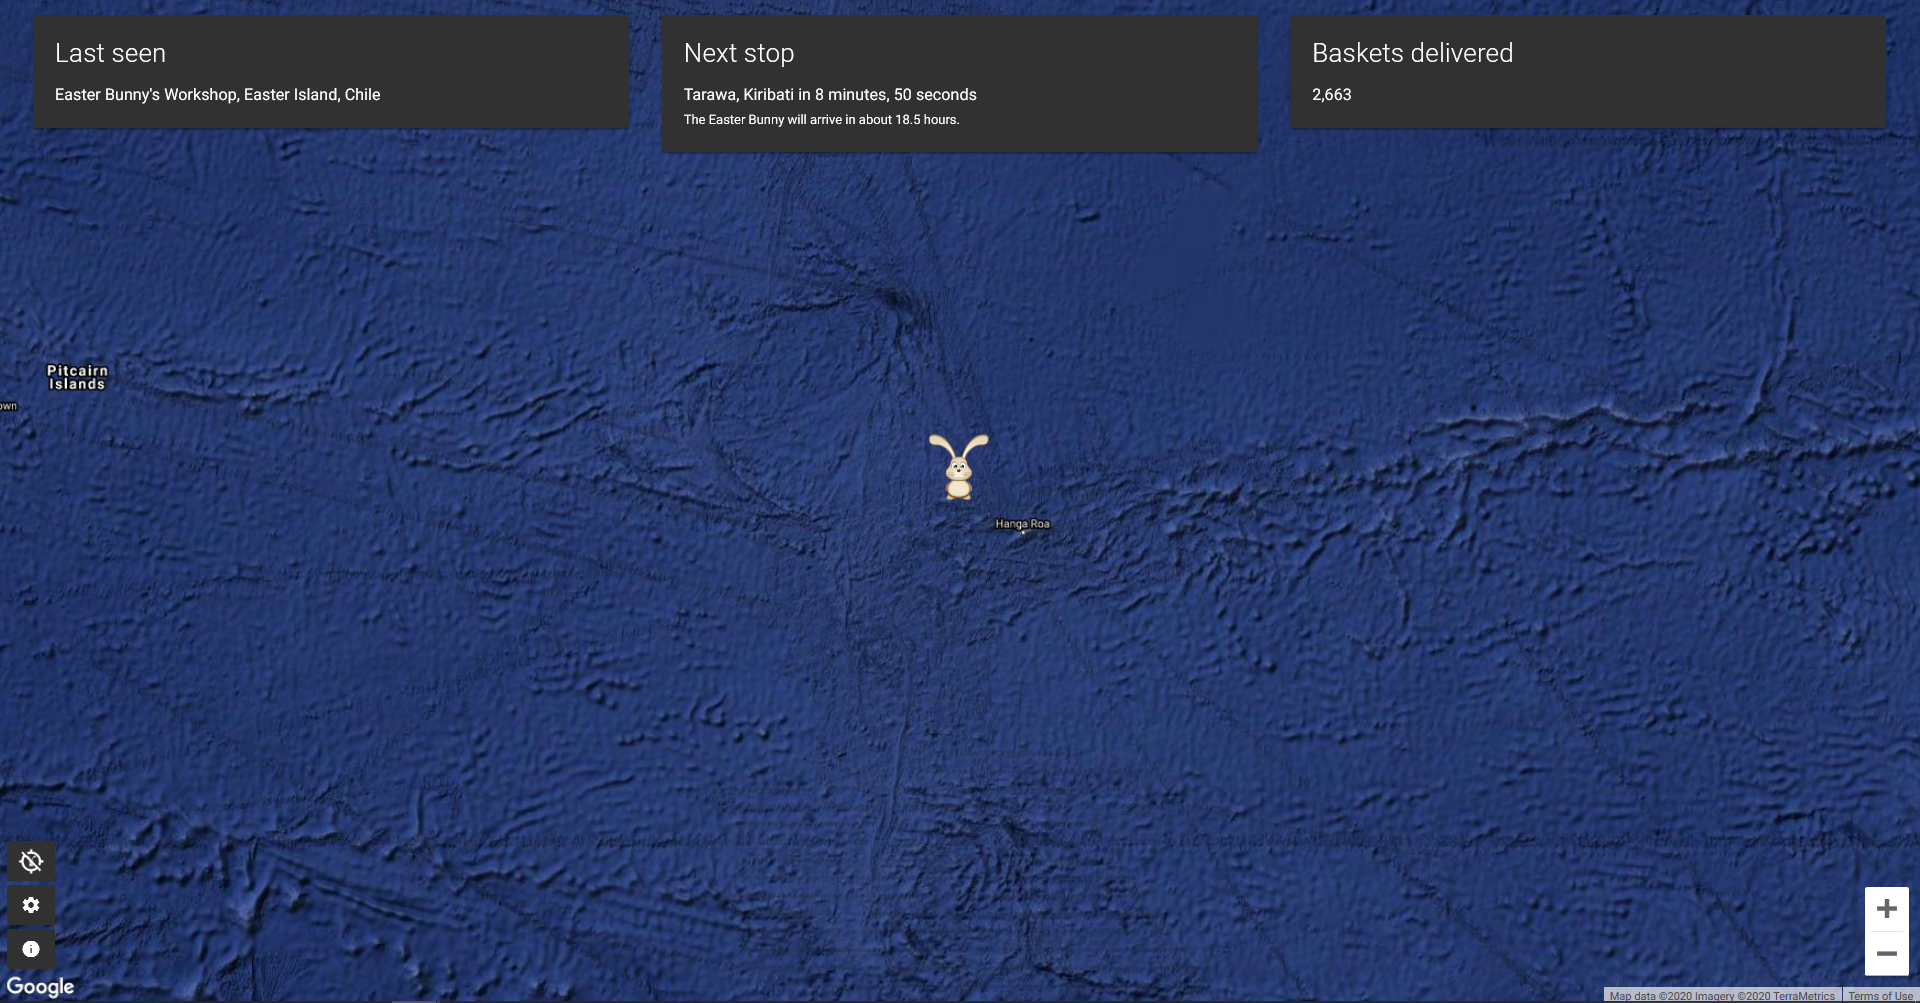
Google’s Santa Tracker has a feature that shows an estimated arrival time for when Santa will reach your location – and we wanted to replicate this in track.easterbunny.cc. Getting the estimated arrival time was pretty interesting, and my favorite part of Version 4.
For pretty obvious reasons, we had to use IP geolocation rather than requesting location in the browser (which would prompt the user, and it’s supicious for a tracker to need to get your location). Within a few days of the first idea, I stumbled upon MaxMind’s databases for IP geolocation, and away we went.
Since we don’t need pinpoint estimates, we ended up using the free GeoLite2 database (In densely populated areas, stops are separated by ~50-100 miles). I set up a Geo API using Python & Flask, along with MaxMind’s Python library to return the approx latitude & longitude of the user.
Once the tracker loads, we’ll request the Geo API, then use a fancy pants haversine calculator (from stack overflow, of course) to figure out the nearest stop’s datarow by distance. After that, it’s a simple game of doing some math, and rounding the arrival time to .0 or .5 hours (Google does this as well).

Visual of how the arrival estimate looks when the EB is 18 hours away. Click the image for more detail.
When the EB is within 45 minutes of the nearest stop, the arrival text goes to “The Easter Bunny will arrive soon!”. Once the Easter Bunny reaches the nearest stop to your location, the arrival text automatically hides.
Protecting the privacy of those streaming the tracker online
When developing the estimated arrival time feature, a top priority was making sure this estimate could be hidden – especially for people streaming the tracker online. It’s a two-fold reason:
a) 95% of people watching a stream will not be geographically close to the streamer’s location, so the estimate wouldn’t be accurate
b) It can reveal the approximate location of the streamer
In the settings window, we added a way to hide the arrival estimate. If the hide arrival time option is off when the tracker loads, the Geo API is still queried. The query is still made so if you want to turn the estimate back on, it immediately reappears (rather than having to request the API). It also just saves a ton of headaches with tracking the state of the Geo API request.
Overall, the arrival time estimate was a pretty awesome success! Even though the Geo API was hosted on my VPS, there were no issues with reliability.
(having zero caching also meant the Geo API was our internal hit counter. after tracking, i made a goaccess report and figured out some interesting stats about the tracker.)
Easter Bunny bouncing effect
A feature that was requested a lot in 2019 was making the Easter Bunny bounce on the tracker. Google has an option to animate marker animation, with bouncing as one of the options.
Getting the bunny bouncing effect implementation was pretty easy. An option in settings would allow users to turn on the effect. We had the bouncing effect only happen during tracking, so in the transitions from pre-tracking to tracking, we added some code to start the bunny bouncing animation.
The same goes in the opposite direction when tracking ends – we also had to add code in to stop the animation as well.
Another thing I noted in testing was the bouncing effect doubled CPU usage, and would in turn reduce battery life. There’s a clear warning in the settings window about implications, just so we’re fully transparent.
The issue with the bouncing effect? It’s not synced to the map. Sure, it looks really cool, but Google bounces the marker every 750ms – while the map moves every 1000ms. I wasn’t about to refactor the tracker to run on 750ms intervals, or have the bouncing effect with a duty cycle of 75% (on for 750ms, off for 250ms). So, it’s a bit out of sync.
Extended stop data
NORAD’s tracker has a neat feature where if you click on a place Santa visited, it throws up a Wikipedia iFrame so you can learn more about the stop. We wanted to emulate this in the tracker, but do it natively (no iframes, basically). This became a pretty interesting challenge early on in tracker development.
For the tracker implementation, we decided on having basic stop information at the very top. This included the country flag, arrival time, weather on arrival (was climate in the early days), population, and elevation (in meters/feet). After that, a horizontal line, followed by the first (and sometimes second) paragraphs of the city from Wikipedia. Below that, there would be a full link to the city article to learn more, along with the CC attribution.
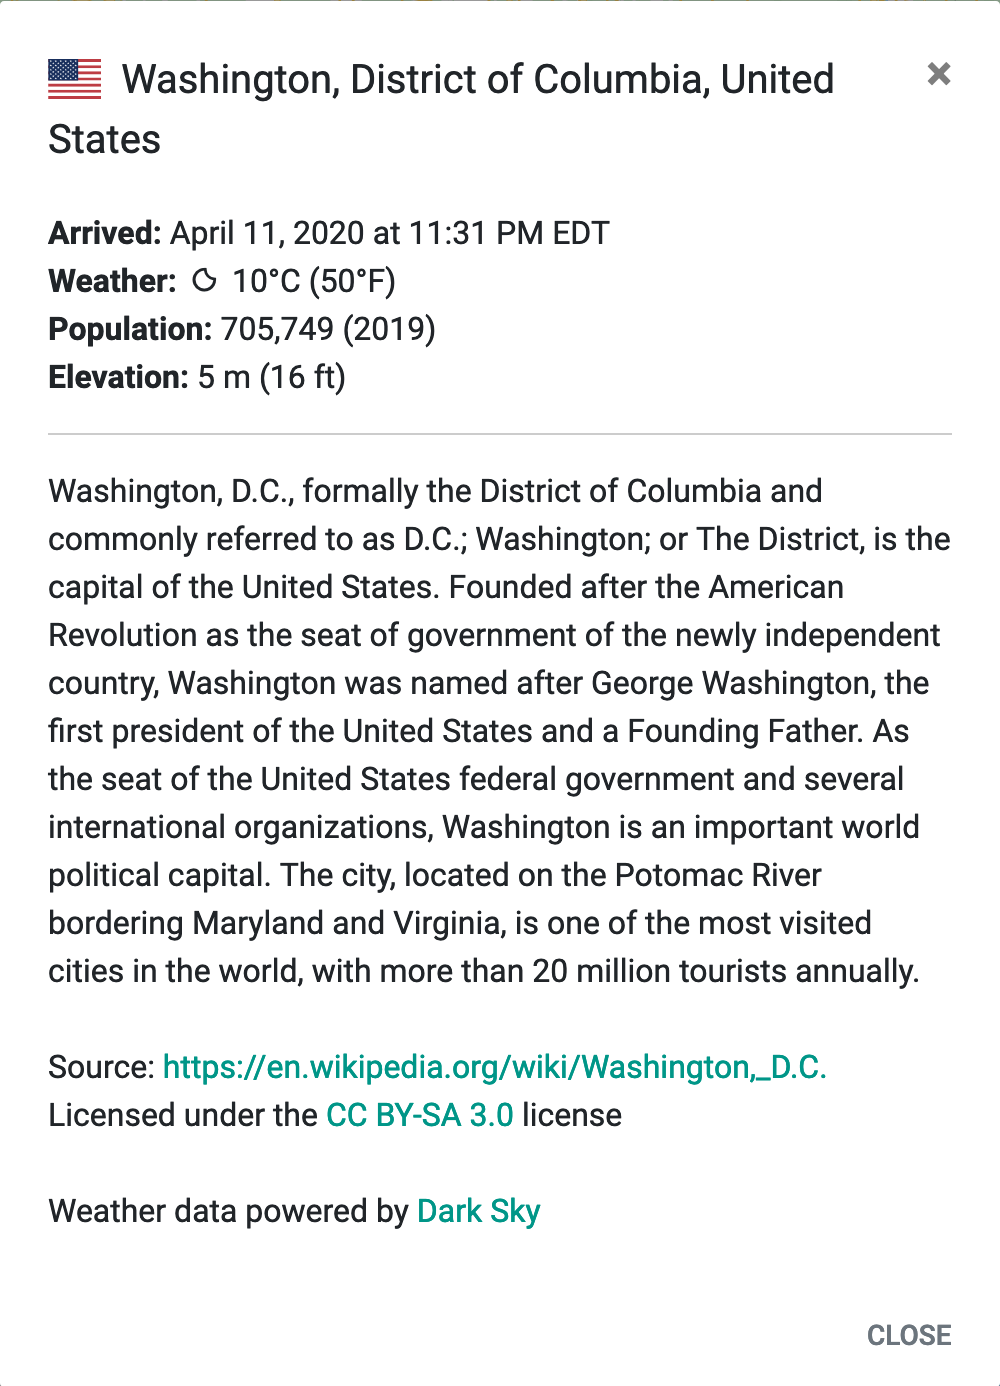
This is the extended stop data for Washington, DC in the final revision of the tracker.
Timezones suck, moment.js comes to the rescue
For the arrival time, we wanted to have it localized to your timezone (and also have the timezone abbreviation because why not). JavaScript handles getting the localized month, date, year, and time, but the timezone abbreviation is where things get interesting.
I had the foresight to know in 2021, Australia (and other countries) would move their clocks back during the tracking run. Given Australia has come in the top 5 countries for traffic, getting this implementation right was pretty important.
We used moment.js timezone to get the timezone. The important part is to clear the cache every time (you’ll see in the code snippet below), and then calculate the local timezone for the arrival time.

With this implementation, the timezone abbreviation is synced with whenever the EB arrives a stop. For instance, we tested the tracker when the US went into DST. The last stop before the DST change occurred had the arrival time of 1:58 AM EST, and the next stop after the DST change had the arrival time of 3:01 AM EDT.
For about 2 weeks, Jamie (a team member) and myself copied in descriptions, population data, and city elevations from Wikipedia for the 500+ stops on the route. But, copying & pasting brings up a few issues:
1) Wikipedia includes pronunciation for the city in the description, which we had to manually remove
2) Wikipedia has those fun references ([1], [2], etc)
3) Other formatting crap
Route compiler to the rescue!
To help automate the cleaning up of the Wikipedia entries, I upgraded the route compiler used in 2019 to automatically remove references, weird formatting issues, and lots of other crap. The compiler is a simple Python script.
When we wanted to implement weather on arrival data, I decided to use the (now dying) Dark Sky API. For every stop, we get the coordinates, request Dark Sky for the forecast, and put in the temperature, condition summary, and the icon name so we can show the weather icon on our end (see the screenshot from above).
Closer to when tracking started, I also added in checking for missing fields, and to check if the baskets delivered count went backwards (we had a few issues with that).

This is how the extended stop data looked on January 12, 2020. Before switching to weather on arrival, we displayed the climate of the city with Koppen climate codes. You can also see a perfect example of the automatic timezone abbrevation, as this was pre-DST change in the US.
Country codes for flags
A super cool attention to detail thing – we wanted to have the country flag of each stop in the top left corner of the stop window. For some context, the master EBT route is in Google Sheets.
To get country codes, I duplicated the main route, sorted the country row alphabetically, and had the ISO-3166 country code list in another window and went to town. It was a one-time process, so I didn’t want to worry about automating the process.
The extended stop data has got to be the coolest feature in the entire tracker. I’m really happy about the way it came out!
Integrating pre-tracking
One of the big things we wanted to get in Version 4 was the integration of pre-tracking into the tracker. As you saw in v3, pre-tracking was a stripped down version of the main tracker. Since we were making tons of big code changes, not having to deal with a separate pre-tracking page was pretty important.
The actual implementation on the tracker side isn’t too bad. We reused the same UI & code from 2019 for pre-tracking functions. The UI for pre-tracking is hidden during tracking, and vice versa for the tracking UI during pre-tracking.
On the routing side, we integrated the pre-tracking updates into the main route. The pre-tracking updates are indicated by a region name of “pt”.
The tracker keeps track of the state of pre-tracking by looking for when the “pt” region code, and setting a global pt_state variable to true. When the transition from pre-tracking occurs, the trigger function (or vischange function, if the tracker is tabbed out during pre-tracking, then tabbed in during tracking) will pick up the state switch, and run special code to make the transition from pre-tracking to tracking.
One minor improvement with pre-tracking compared to 2019 was the addition of time until liftoff on the next stop box, but just for mobile devices. Rather than using a breakpoint, the element has a @media CSS rule with a minimum width of 576px (the upper end of small for Bootstrap) to not show the element.
Horizontal shifting = better usability
One big issue we encountered in 2019 was the tracker was not very usable in landscape mode on mobile devices. The Easter Bunny would be obstructed by the last seen & next stop boxes, which obviously isn’t super great.
To get around this, we implemented a feature known as horizontal (landscape) map shifting. The basic premise is when a mobile device enters landscape, the map is shifted up by landscape height * 0.33 in px, and then goes back to normal when in vertical.
Every time an orientation change occurs, we run a function called parse_oc to parse the orientation change, and make changes as necessary. This includes comparing the last orientation to the new orientation, mostly so going from 90 degrees to -90 degrees (or vice versa) doesn’t trigger a horizontal shift.
Implementing horizontal shift was pretty interesting and had three interesting roadblocks to development
1 – Making sure the map stays shifted
When a horizontal map shift occurs, we pan the map by 0.33x the landscape height in pixels. However, the next time the bunny marker updated, this shift wouldn’t be applied. To get around this, we did fun stuff with map projections & overlays. Here’s the code which does a better job explaining itself than what I could do explaining this.

don’t @ me, i know i can simply the if statement to if (mapCentered)
2 – Chrome on Android 10 stopped reporting the orientation, because Google sucks
Halfway through development of this feature, I noticed for some unearthly reason, Chrome, just on Android 10 (Android 9 and under work fine, for some reason??) will trigger the orientation change event listener, but not actually report the orientation of the device.
We know in landscape mode, the inner height is less than the inner width. In portrait, the inner height is greater than the inner width. And that’s how to determine the orientation the dumb way.
To figure out if an orientation change actually occurred, in addition to storing the last known orientation, we also store the last inner height & width, so it can be compared to the new inner height & width to see if an orientation change actually occurred (and more specifically for Android 10 Chrome compatibility)
3 – iOS has a major delay when reporting the actual inner width & height after an orientation change
As is tradition, WebKit is gonna be WebKit, and WebKit is gonna fuck something up. In this case, I noticed WebKit had a pretty decent delay in returning the actual inner width & height after an orientation change.
Before I realized WebKit was being WebKit, the orientation change parser would run instantly. But, with the magic of WebKit being WebKit, I had to add a 600ms delay to the entire parser, because WebKit is going to be WebKit.
Did I mention how much I hate WebKit?
4 – Sometimes the orientation change occurred on an iPad, so there’s a height limiter. And a width limiter…for some reason?
To avoid the issue of having the orientation change code running on an iPad (because that’s bad), the orientation change parser will only run if the inner height in landscape more is 499px or less. The height filtering worked great.
I then preceeded to add a width restriction of 820px or less for some dumbass reason. I then preceeded to test horizontal shifting on a Fire 7, saw it didn’t work as expected. But, I also saw the bunny icon was obstructed. This should have prompted a fix to make it work, right? It’s literally half a line of code.
And I didn’t for some reason, because I’m stupid.
Dark mode in the infra pages
The tracker has dark mode, but the FAQ, News, etc (Infra) page didn’t have dark mode. Absolutely tragic, I know.
To get dark mode working in the infra pages, I took a page from how Android Police handles dark mode on their website. They have a button that cycles through automatic mode, light mode, and dark mode with a button in the top menu. For the infra pages, I did mostly the same thing. There’s an icon in the top right of the title section, that when clicked, cycles one way through the appearance cycle.
Getting the JS to work was pretty easy. To save myself a lot of trouble, I made the functions to handle the whole thing in a JS file, and imported them on every page.
The changes made on the infra pages syncs over to the tracker via local storage (and doesn’t when its unavailable).
What doesn’t sync? The actual appearance of the tracker
Right after everything seemed fine and dandy with this new feature – I realized a big flaw. Let’s say a user has the FAQ page in a tab, and the tracker in another tab. If the user changes the appearance on the FAQ page, it doesn’t sync with the tracker (and vice versa).
To get around this, I added a mini vischange to the infra pages that will read the local storage value for the site appearance, and change appearance accordingly. I also did the same thing on the main tracker as well.
Hard linking in the news page
The track.easterbunny.cc news feed is a very interesting page, mostly because it’s static HTML and isn’t WordPress. Unfortunately, the news page was also starting to get pretty long. There was no easy way to link to one specific article, which was starting to become an issue.
The solution? Element linking! Every modern browser allows you to specify an element to scroll to by adding #elementname to the URL.
Each post on the news page has a number ID. For instance, if I wanted to hyperlink post ID 50 on the news page, I would enter https://track.easterbunny.cc/news/#pid-50 into my URL bar, and I’ll be shown the post that corresponds with ID 50.
In addition to the hard linking support, I also added in a link with every article to make it easy to share the article. A modal with the hard linked URL pops up, with a copy to clipboard button as well.

This is how the share modal looks on the news page.
Supporting older devices
During QA, I realized not all devices will properly render the share modal, and/or have the ability to copy links to the clipboard.
Similar to how incompatible browser checking works with the tracker, I used bowser to create a set of browsers that are incompatible with the share modal. If a browser is known as incompatible, text with the hard-linked URL is shown, rather than a link to the modal.
Twitter updates, please!
Last year, in addition to traveling, running a live stream, and running the tracker, I also tried to run the social media feeds for track.easterbunny.cc. To say it was a disaster is putting it mildly.
Every so often in 2019, I tweeted a status update about where the Easter Bunny was last seen, the next stop of the Easter Bunny, and the baskets delivered count. It was a really good idea, but having to manually post the status updates was a real pain in the ass.
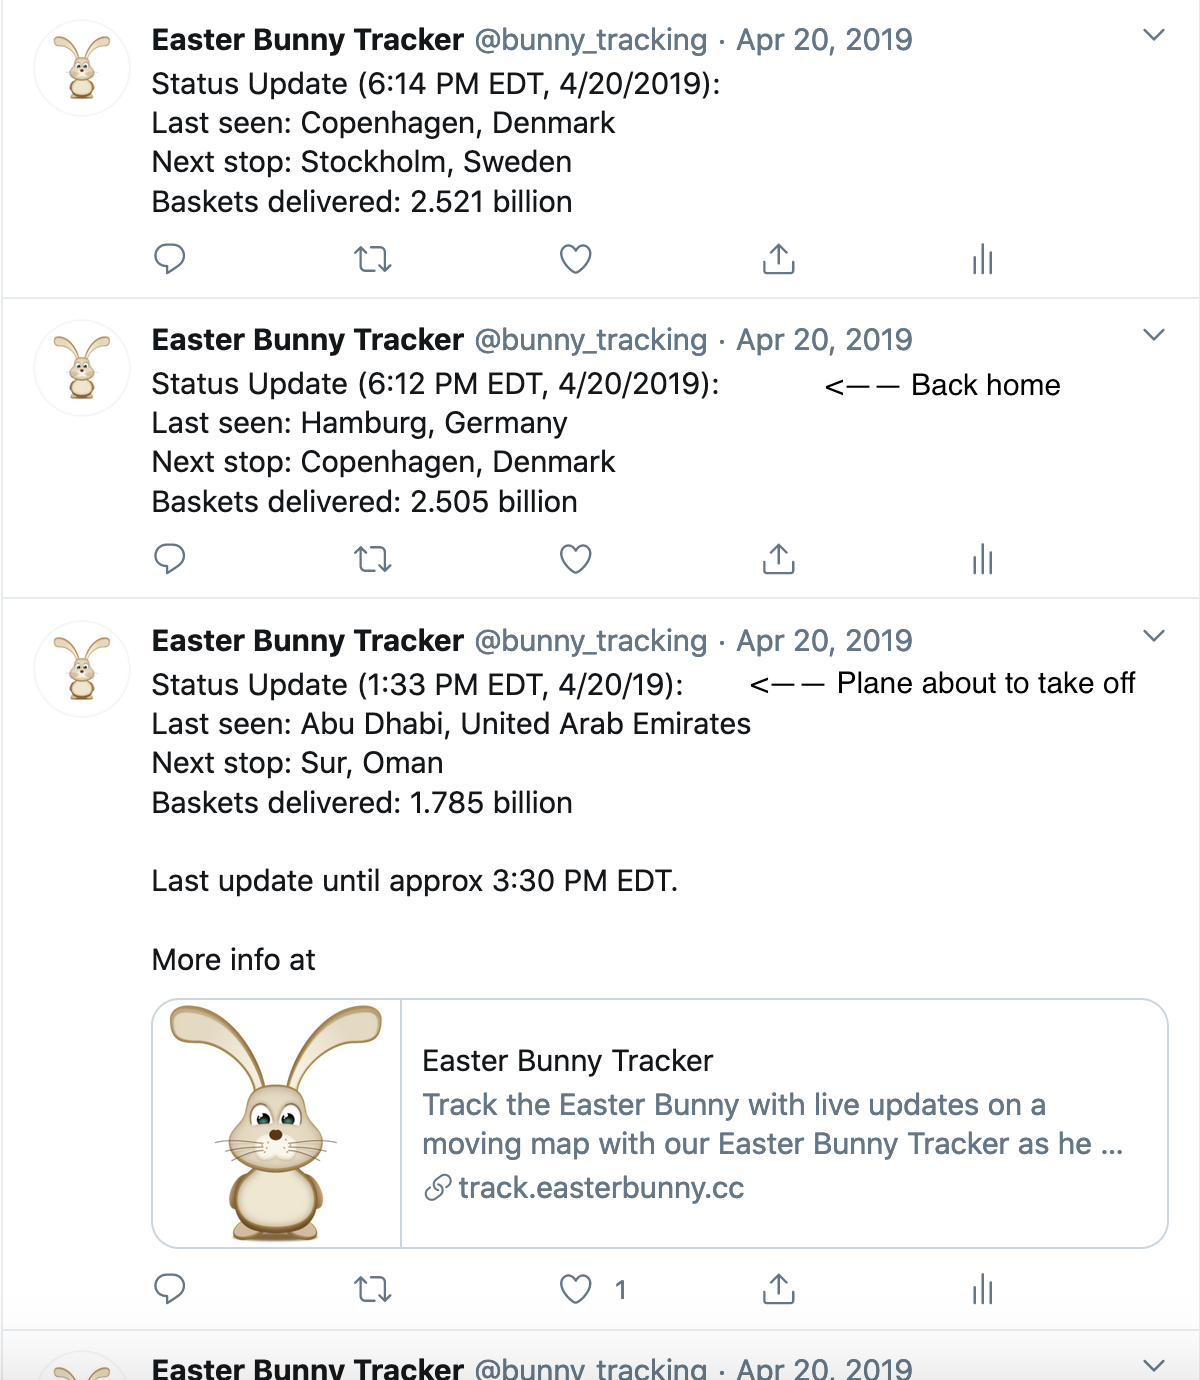
This is what the 2019 updates looked like. With some annotations. Also, yes, I’m one of those people who don’t turn on airplane mode until the plane is actually taking off. In a few years I’ll look back at this post and think, “why the hell did I make that comment about airplane mode??”. Also, hi future self!
The solution to this? Make something that would automatically handle these status updates.
Using, you guessed it, Python, I made a simple Twitter bot that would read the route file, and tweet out updates thanks to Twython on the Easter Bunny’s status. Every minute, cron would trigger the script on my server. I also included methods to avoid tweeting multiple status updates for one datarow.
Abbreviating the baskets delivered count
To try and keep the style similar to my tweets in 2019, I wanted to make sure the baskets delivered count was getting abbreviated (with at most 4 digits), with units included. I also wanted to make sure all 4 digits were being filled (e.g. 4,100,000,000 baskets would show up as 4.100 billion instead of 4.1 billion).
After some Stack Overflow searching, modifications, and testing, this is what I came up with. There’s a separate function to do the actual formatting, and then more code to handle backfilling the digits. I also wanted to make sure the very final stops didn’t show 4.4 billion baskets (as they should be 4.399 billion) for a dramatic-ish effect.

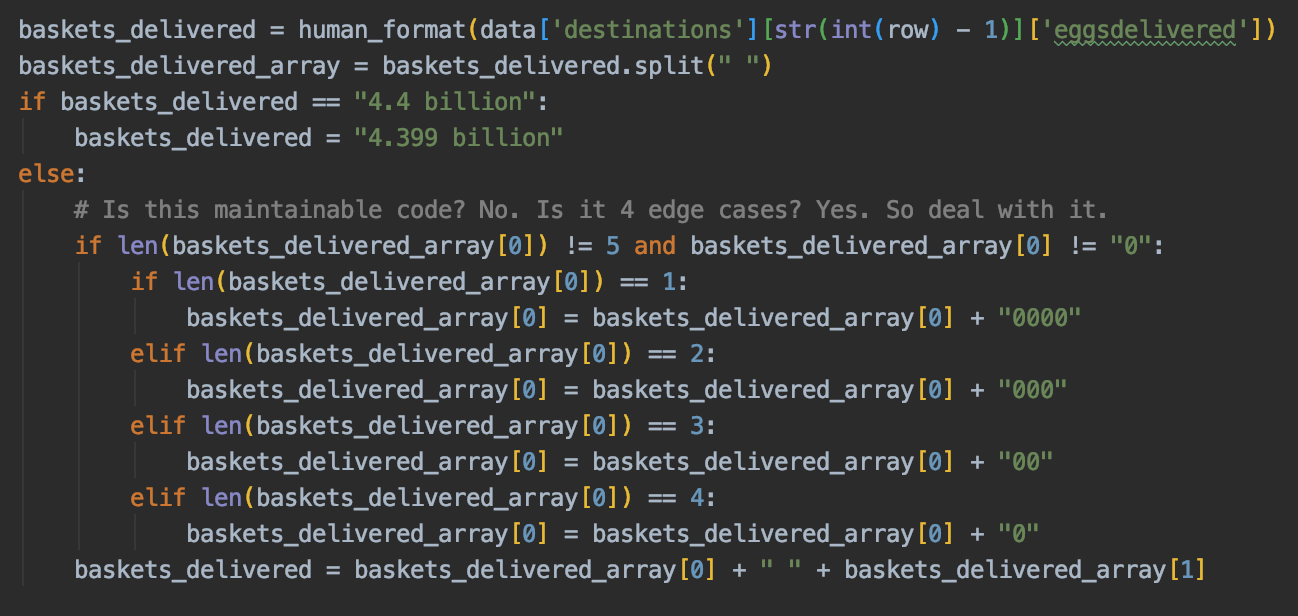
Don’t mind the snarky code comments
Once testing started, I realized I went a bit too far. 600+ status updates randomly showing in your feed is a bit unexpected, to stay the least. Yes, it’s mighty cool, but it’s also mighty uncalled for.
The solution? Two separate twitter accounts, doing two separate things!
Separate Twitter account #1 – The main one
I still wanted to have status updates for our main @bunny_tracking Twitter, but not to the volume the Twitter bot would produce. I ended up making about 100 pre-scheduled tweets in a Google Doc that would be tweeted out every 10-20 minutes. The tweets would have information about the regions the bunny was in, where the bunny was going next, and the number of baskets delivered.
TweetDeck has the option for scheduled tweets, so I used that to schedule them as according to the document.
This is what one of the scheduled tweets looked like. The status updates tweets followed this same format. Whenever the EB reached a billion basket landmark (e.g. 1 bil, 2 bil), I pointed it out in the bottom part of the tweet. Check out the Twitter page for the full listing of status updates from 2020!

Separate Twitter account #2 – @bunny_updates
To avoid spamming Twitter feeds out of nowhere, I created another Twitter account with the handle @bunny_updates. This Twitter would exclusively be the home of the Twitter bot that would tweet every single update.
As the days neared towards tracking, I posted multiple warnings about Twitter spam ahead. Seemed to do the trick, 0 complaints came in.
There’s not much more to this, other than I advertised you could track the Easter Bunny on Twitter. And yes, you very much could.

This is why we did the whole separate accounts thing.
Quick little note: In the first revision of the bot, I didn’t include the amount of time it would take for the Easter Bunny to reach the next stop, so it was sort of a mystery. I decided to add in the time it would take for some extra perspective.
Launch day (again)!
Hippity hoppity, it’s launch day! Version 4 had a pretty variable release time, mostly in part due to the whole coronavirus thing. The final release date was March 22, 2020 at 6 PM EDT.
The reception was very good. People liked the tracker, and of course they did. We released about a day or two after Track Easter Bunny released their 2020 improvements.
We are now the only tracker you can stream?
Something interesting happened in the leadup to the 2020 tracking. After doing some dives on Track Easter Bunny, I discovered in their Terms of Service that people weren’t allowed to stream their tracker in an effort to protect what they made, because…reasons?
This is a boneheaded thing to do. We then proceeded to roast, and roast, and roast Track Easter Bunny on Twitter.
Of course, I want as many people enjoying track.easterbunny.cc as possible, so I’ve always allowed streaming of the tracker. In the days up to tracking, I posted some cool tips about streaming the tracker online.
URL arguments – Post-release feature
The URL arguments feature in track.easterbunny.cc is a weird feature that I haven’t yet decided about its long-term fate. Basically, my dumbheaded brain thought that you couldn’t interact with an OBS browser, and by extension, you couldn’t change settings. That’s why I made a whole, full-fledged system that would allow people to set tracker settings via URL arguments.
For instance, if I wanted to view the tracker but also change the map mode to hybrid, I’d put this in the address bar:
https://track.easterbunny.cc/?mapmode=hybrid
In the UI part of Version 4 (which you read by now, right??), there’s screenshots regarding the syntax checker for URL arguments. Now that was the coolest part of this entire feature.
Increasing icon resolution – Post-release feature
About 3 days out from launch, I had the random thought of increasing the icon resolution for the tracker. The icons we were using weren’t very high resolution, and were blurry on higher resolution devices. The Google Maps API has the option to load in images and scale them down (say, loading in a 120×120 image, and scaling it to 60×60 on the map). I decided to go ahead and make these changes very close to launch.
I then realized I fucked up the anchor position of the icons, so the extended stop data window was popping up when clicking on not baskets. This freaked me out for about 2 hours straight, and then I realized, yep, I’m a bit stupid.
Trimming the countdown – Post-release feature
About a day and a half before the tracker launched, I decided to make a quick feature change to make the countdown more exciting. I enabled the trim feature in Moment.js for the countdown. When it wasn’t necessary, the day/hour/minute counter would be removed. For instance (before | after):
03:00:00:00 | 03:00:00:00 -> 3 days out
00:12:00:00 | 12:00:00 -> 12 hours out
00:00:30:00 | 30:00 -> 30 minutes out
00:00:00:30 | 30 -> 30 seconds out
This one change made the final countdown so, so, so much more exciting.
4 months of work comes down to 28 hours (round 2)
Similar to what happened in 2019, 4 months of work was about to come down to 28 hours. However, for 2020, we invested considerably more time into the tracker, so a successful tracker launch would mean the world to me.
In the final hour before track.easterbunny.cc launched, something interesting happened. Our competitor, Track Easter Bunny, launched about 1 hour before us, at 1 AM EDT. This was previously unannounced, and strange – they didn’t have pre-tracking.
As the time creeped closer to 2 AM EDT on the 21st, on my 2020 EBT stream, the Final Countdown started playing in the final moments to liftoff. Then, as is now tradition, the iCarly theme counted down to pre-tracking started.
Just like 2019 – everything worked flawlessly. Nothing crashed – even with about 150 users pinging the Geo API at the same time and loading the tracker. At this point, I was crying tears of joy saying “we did it!”.
Holy moly the growth
As the night continued to go on, I noticed the site was getting a lot more traffic compared to last year. As pre-tracking ended, the site had already reached 2,000 hits, half of the traffic from the previous year. I was estimating about 1.5-2x growth, and now I was estimating about 6x-12x growth.
Why all the growth? Coronavirus. Because everyone was inside for Easter, and many traditional Easter activities were cancelled, more and more people turned to Easter Bunny tracking than usual. The same effect occurred on the tracking streams on YouTube. My stream hit a peak of 520 viewers – 2.5x the record set from the year before, and on par with that of a Santa Tracking stream.
As the morning went on, I continued to report the hit count on my Discord server. At 5:14 AM, the hit count surpassed 2,000. Later in the morning, according to one member, the tracker was briefly featured on RTE Ireland’s morning news show. As I took my nap, at about 7:00 AM, the site had eclipsed the number of hits it got in the previous year – this was absolutely unprecented growth. I started to worry we’d exceed the Google Maps API free tier, because the tracker was getting so popular.
By 9:00 AM, the hit count was already at 5,500 (remember – at 9 AM last year the hit count was around 500 so this was unprecented for us). At 10:48 AM, the most important number was reached – 6969 requests.
I’ll stop being a child
About 10 hours into the tracker at noon EDT – we crossed over 8,000 hits. 1:30 PM, and we were over 9,000 hits. At this point, I was expecting about 25,000 hits, with 30,000 hits being a high number. Spoiler alert: I love underpredicting things.
Holy moly the growth (part 2)
Sometime around 3:00 PM EDT, the tracker passed 10,000 hits, and this was before the peak of tracking hit later in the night. The tracker just kept getting more and more hits. The damage was done – I had just made a damn good Easter Bunny Tracker.
Around 5:00 PM, we had about 12,000 hits. 30 minutes later, 14,000 hits. For comparison – in 30 minutes, we accumulated the same amount of hits in about 12 hours on the first run of tracking. Just before 6 PM, we crossed over 15,000 hits.
Later at about 8:30 PM EDT, we crossed over 20,000 hits. This was now within the 6x-12x range that I re-predicted, and we still had 10 hours of tracking under our belt, and a solid amount of peak traffic to go.
At this point, I was more impressed with how unintentionally scalable the tracker was. We were getting 8x the traffic and nothing crashed. Cloudflare took an enormous load off of the servers – with pretty strict page rules, the caching rate was 98%.
Realizing what track.easterbunny.cc meant
As the tracker rolled on into 10 PM, I had a moment to myself wondering what I had just done. Holy moly, I had just made a super popular tracker that got an assload of hits in a very short amount of time, and a million thoughts were running through my mind. Was this a permanent project? Did I have to maintain this tracker forever? Should I sell it?
Then I realized – this is all the work of coronavirus. Plus, this was, is, and will always be a hobby project. I realized track.easterbunny.cc was an alternative to Track Easter Bunny. Sort of how Google’s Santa Tracker became an alternative to NORAD’s tracker. There’s something special about independent projects, and I wanted to keep track.easterbunny.cc independet.
Calming down, I went back to moderating stream chat, and enjoying the final hours of tracking after freaking out for about an hour.
I don’t blame myself for freaking out: Although this wasn’t the first time one of my sites got massively popular (see o355 Games), it was completely different as o355 Games didn’t require a ton of active maintenance. Additionally, this wasn’t gradual growth – this was all of a sudden, it just happened.
(on a sidenote: since the coronavirus, traffic for o355 Games has absolutely tanked)
Enjoying the ending
At 10:25 PM EDT, track.easterbunny.cc crossed 25,000 hits. As tracking ended, the site traffic went down, but we were still setting new records. At 1:05 AM EDT on the 12th, we hit 30,000 total hits.
Fast forward a few hours towards the end of tracking. As the 2020 EBT stream was my last stream, I started playing My Way by Frank Sinatra, to commemorate I sort of did things my way. In the same way as 2019, the music was synced to the end of the tracking. As 6:00 AM hit, and the Easter Bunny reached Easter Island, I raised my MacBook Pro (a machine, mind you, costs 4x that of my XPS and I didn’t want to slam on the floor) in a similar way to a trophy (it was the machine that while didn’t do a lot of development on, it did administer all of TEBCC).
And as the Easter Bunny returned home to Easter Island, the site crossed over 35,000 hits in the final moments. The tracker had experienced 854% year-on-year growth.
I also got slapped with a pretty solid $90 Google Maps bill, which is cool.
Oh, did I mention we kicked Track Easter Bunny’s ass? I think we did. They actually didn’t crash during tracking. Yes, they did update their tracker for live updates, but I think we took a solid chunk of traffic away to the point that they never crashed.
Realizing what happened & personal reflection
Looking back, track.easterbunny.cc Version 4 is an experience I will never forget. It is the perfect embodiment of how development works in the real world. From planning, to development, to quality assurance, to infrastructure, to social media, and to release, it’s the most vertically stacked project I’ve ever made. But, at the same time, it’s a real website I run, with real social media, and a real impact on the world.
track.easterbunny.cc Version 4 reminded me why I love being a developer.
Screenshots from the 2020 run (there’s a lot more of them)
Start of tracking | 5:00 AM EDT, 4/11/2020
Australia | 8:00 AM EDT, 4/11/2020
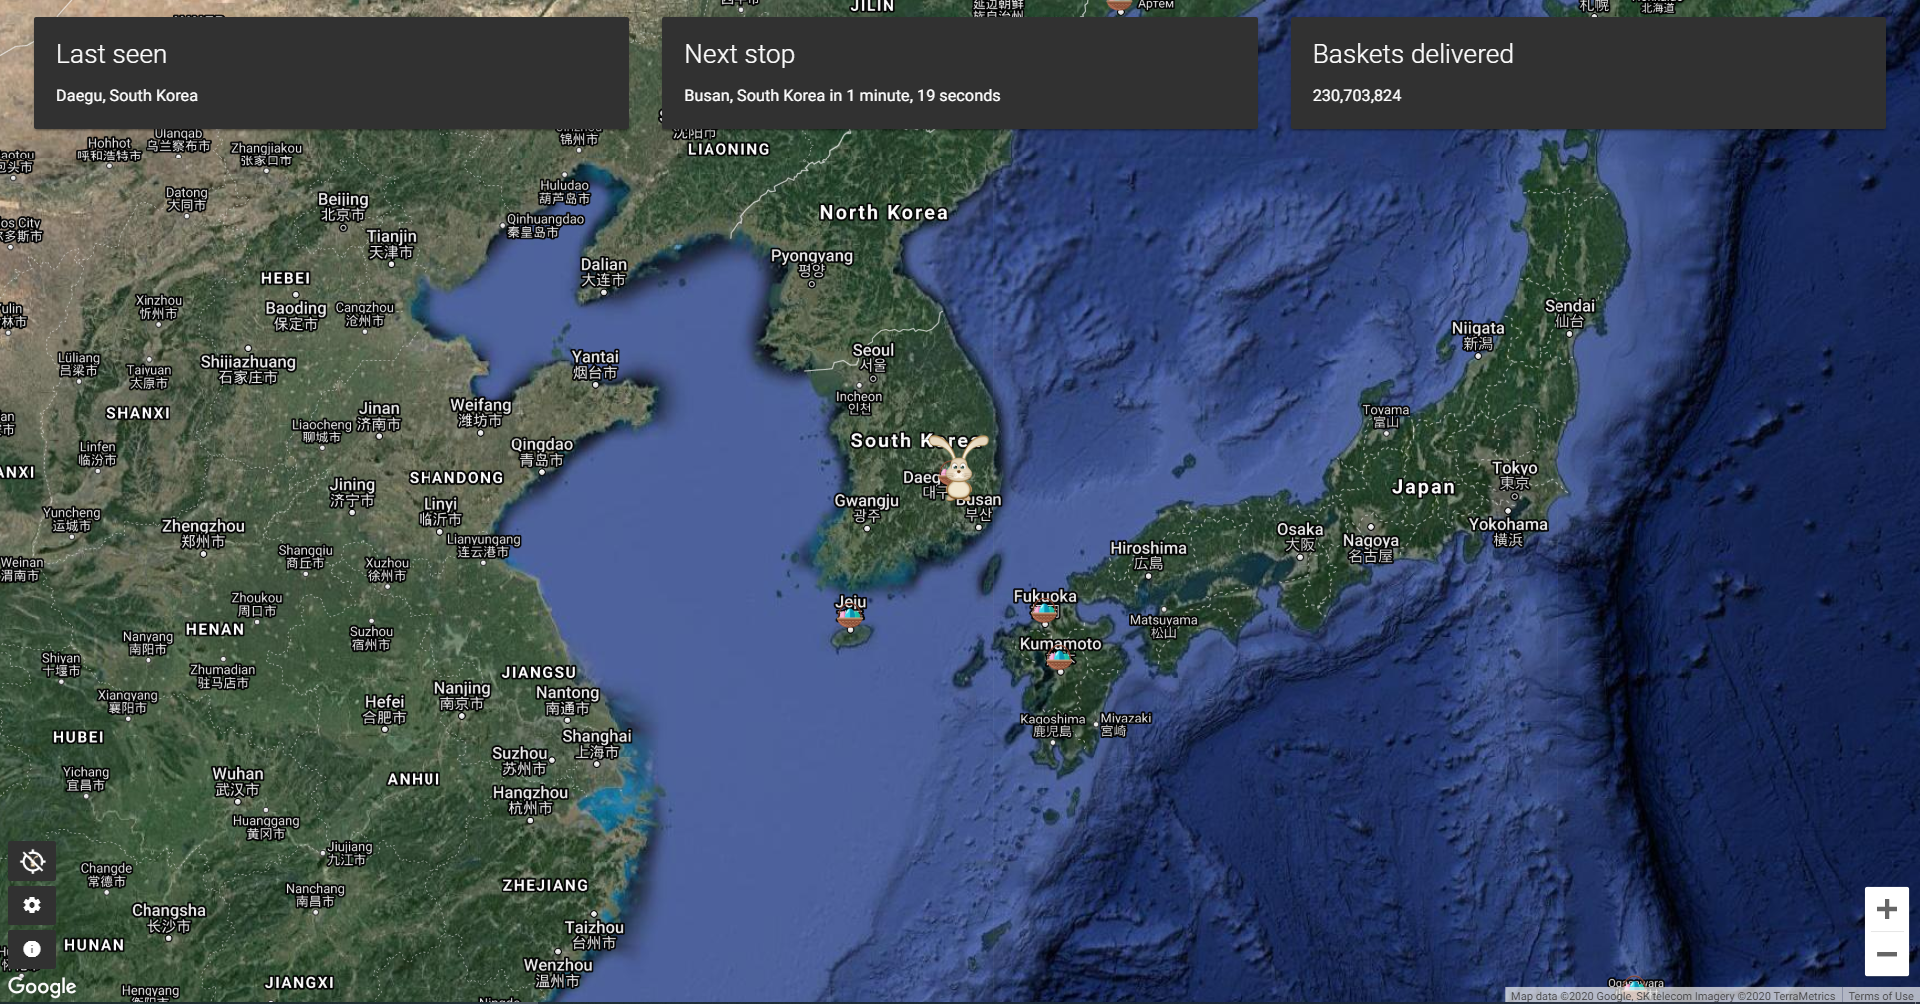
East Asia | 8:45 AM EDT, 4/11/2020

Southeastern Asia | 11:15 AM EDT, 4/11/2020

India | 12:25 PM EDT, 4/11/2020

Southeastern Europe | 3:30 PM EDT, 4/11/2020
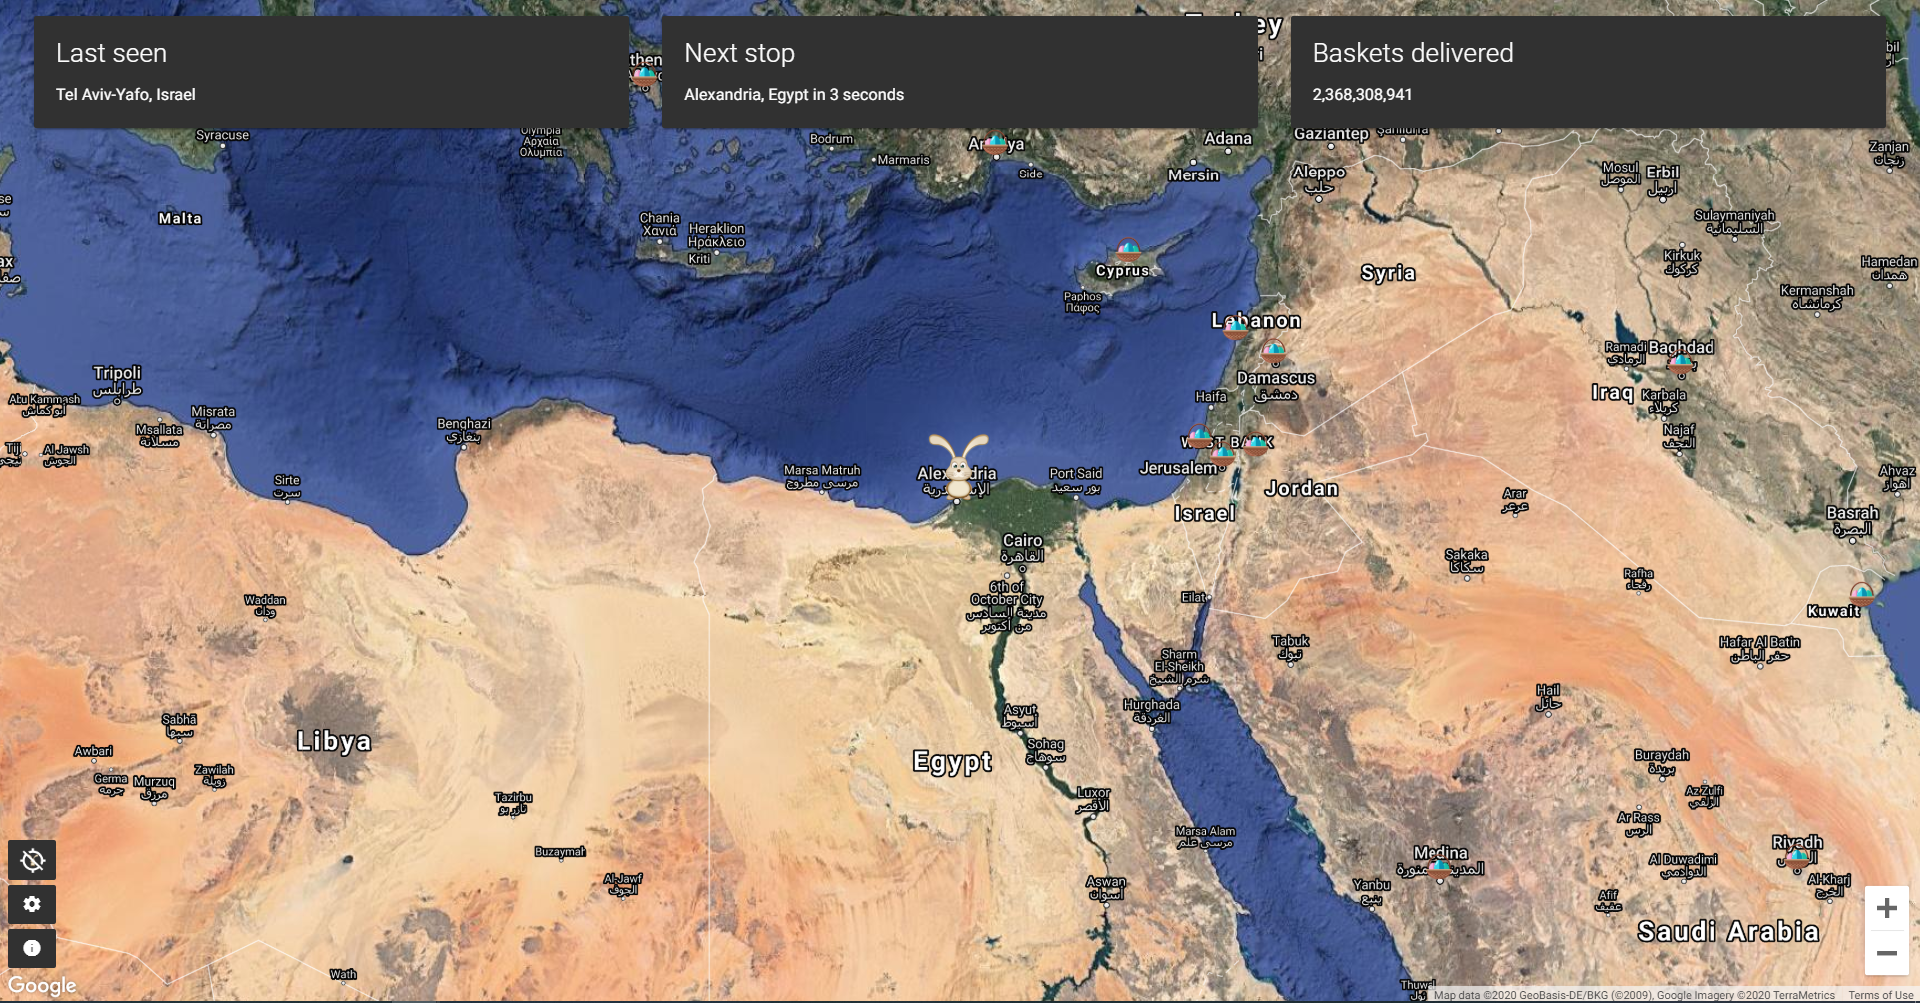
Middle East | 4:00 PM EDT, 4/11/2020

Europe | 5:30 PM EDT, 4/11/2020

West Africa | 7:30 PM EDT, 4/11/2020

United Kingdom & Ireland | 8:30 PM EDT, 4/11/2020
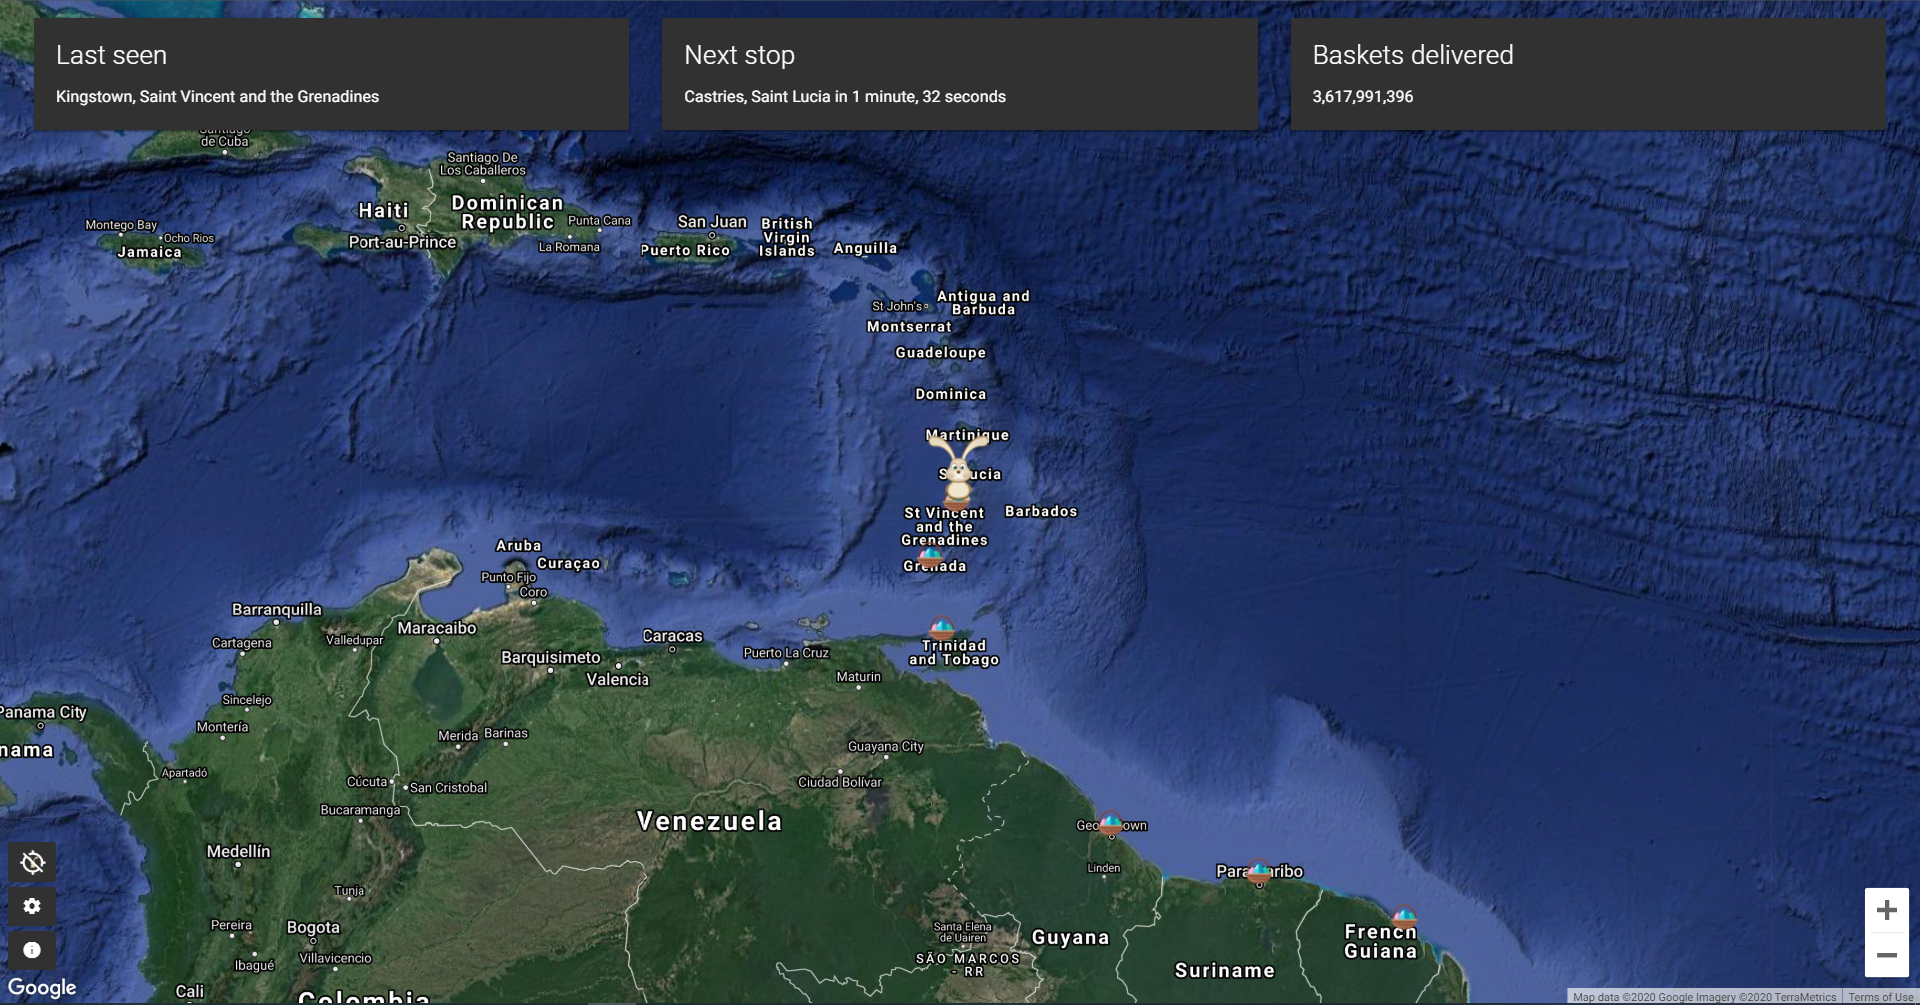
Caribbean | 10:00 PM EDT, 4/11/2020

South America | 11:00 PM EDT, 4/11/2020

United States of America – Southern East Coast | 11:15 PM EDT, 4/11/2020

United States of America – Northern East Coast | 11:50 PM EDT, 4/11/2020

Central America | 1:00 AM EDT, 4/12/2020

United States of America – Midwest | 2:30 AM EDT, 4/12/2020

United States of America – West Coast | 4:30 AM EDT, 4/12/2020
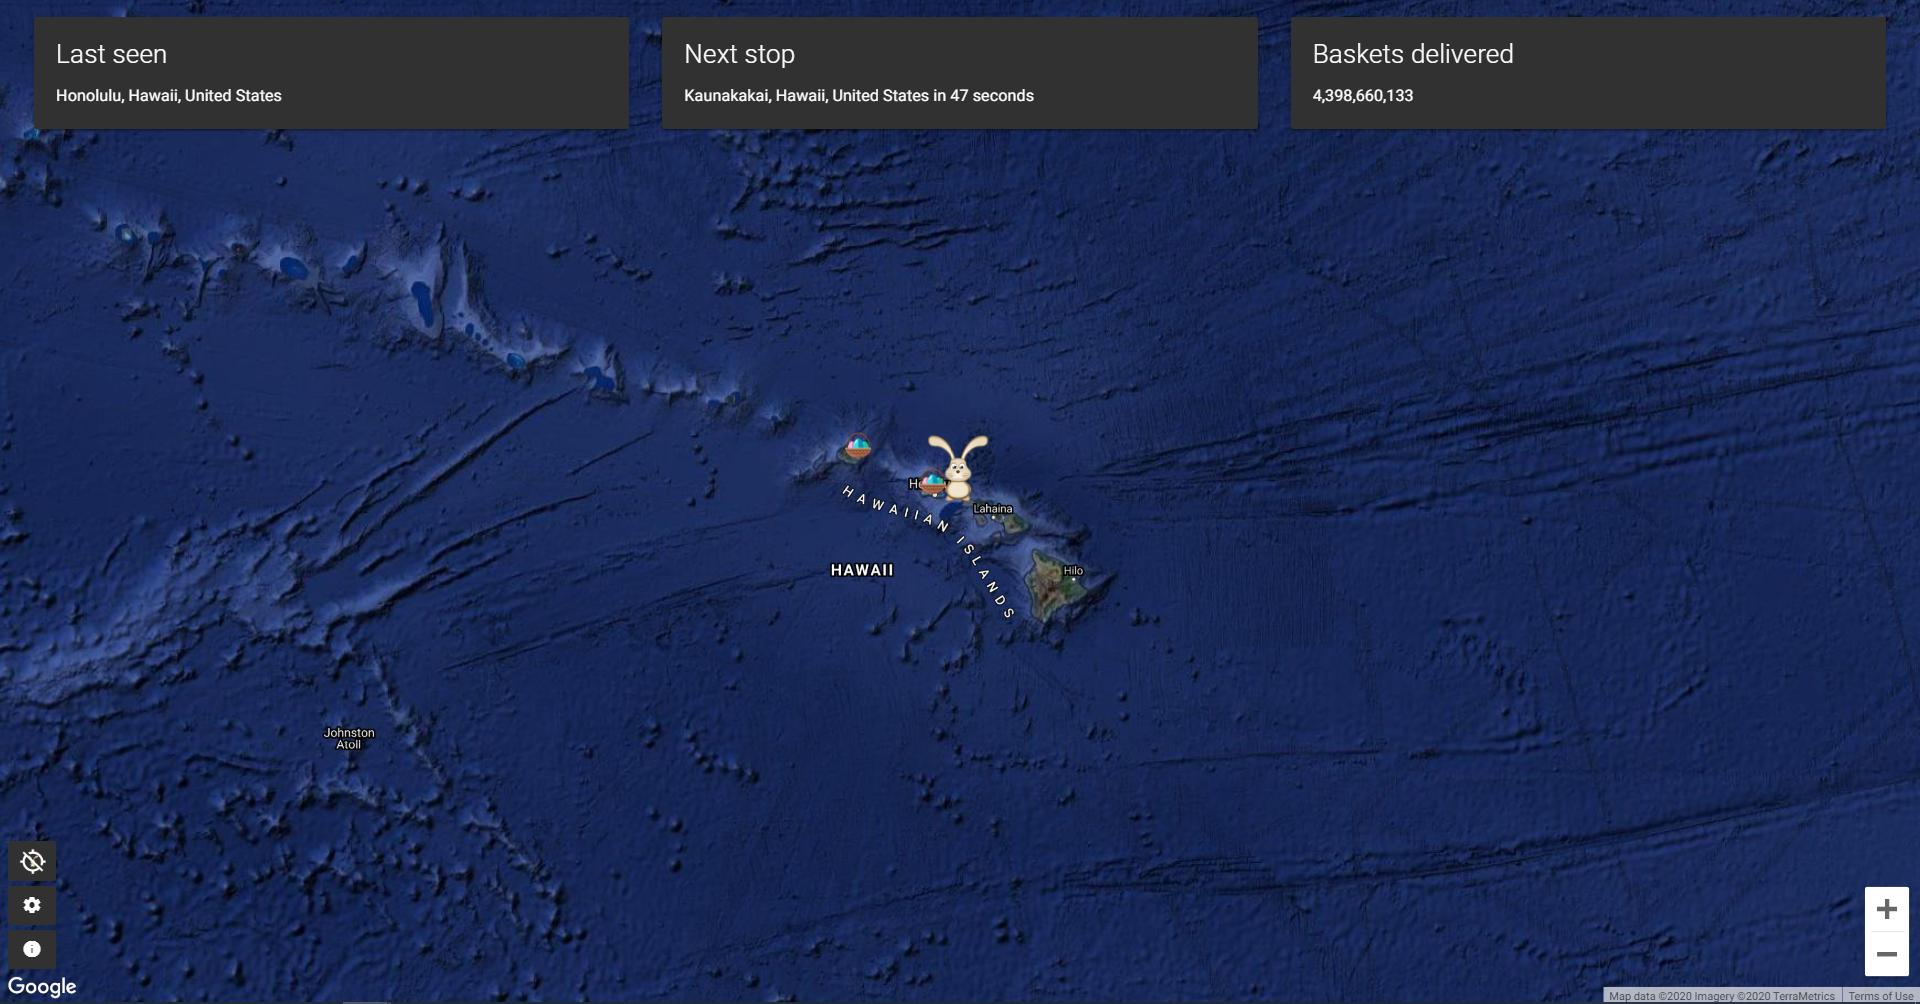
Hawaii | 5:30 AM EDT, 4/12/2020
End of tracking | 6:00 AM EDT, 4/12/2020
Prefer a timelapse? Here’s the timelapse for the 2020 run: https://www.youtube.com/watch?v=FcIz73C3Tz8
What’s next?
Version 5 of track.easterbunny.cc is the next step – due for release in April 2021. Version 5 will mark the final feature-packed release, before the tracker starts getting less features as the years go on.
Tracker development is expected to start in May 2021, and last through December 2021. Due to the current situation with the coronavirus, things are changing and I’ll be home for a while. This means I’ll have full access to my QA devices in a time where I anticipated not having full access to my QA devices. As such, the development period will be lengthened, so I’ll be able to really culminate Version 5 as the last feature-packed release.
In the back of my mind throughout development, I’ve had a three-stage plan to slowly develop the tracker over three years. Version 3 was responsible for laying the foundation of the tracker, which it did beautifully. Version 4 was the tracker maturing. While there wasn’t any blockbuster feature that refined the tracker, it did contain lots of major & minor improvements to make the tracker feel more alive.
Version 5 is a continuation of Version 4, including features we didn’t get time to work on in Version 4, and to further expand our audience. Similar to Version 4 – there won’t be any blockbuster features, rather, more minor (and some, but not as many major) features that continue to mature the tracker compared to Version 4.
World-first: Orthodox Easter Bunny tracking
After the Version 4 run of track.easterbunny.cc, a user of the site brought to my attention that there were no Orthodox Easter Bunny trackers on the internet. The user wanted me to run the tracker again, so that people who celebrate Orthodox Easter could track the Easter Bunny in sync with the holiday they believed in.
Version 5 will have two tracker runs. The first tracker run is the normal Easter tracking run that most people will see, at least here in the US, Australia, and Canada. About a month later, in May 2021, there will be a second tracker run for Orthodox Easter, which I expect to be more popular in Europe, as that’s where Orthodox Easter is largely celebrated (many people in the US also celebrate it as well).
I’m continuing to figure out the details about running the Orthodox tracker, but it will happen. It’ll be exciting to see how the Orthodox tracker performs, as nothing like this has ever been done before.
The end! For now!
This article about track.easterbunny.cc is evolving year to year. I’ve purposefully written the article in a way so that next year in 2021, I will add on to this document with all the new developments, features, and about how the site runs.
First – thank you for reading this incredibly long article, and I hope you enjoyed it! It’s 10,000 words – nearly twice the length of the previous longest post on this site (about code.org, which absolutely sucks). This also took a pretty long time to construct (about 10-20 hours from my estimates, I type pretty fast), especially with all the media! This is by far my favorite article on the website, and I hope it can become your favorite as well!
Second – I hope you were able to learn something about track.easterbunny.cc, whether you’ve used the site or not. I hope that this article gave you some nuggets of knowledge about how track.easterbunny.cc was developed, how it runs, or maybe gave you some inspiration to make a tracker similar to track.easterbunny.cc.
track.easterbunny.cc is now open-source!
After some thoughts and pondering, I decided to make the tracker open-source in May 2020, following the second successful run in 2020. In addition, I’ve open sourced the Geo API, Twitter Bot, and the route compiler to make routes that the tracker can use.
The main tracker repository is here: https://gitlab.com/track-easterbunny-cc/tebcc
And the TEBCC organization on GitLab is here: https://gitlab.com/track-easterbunny-cc/
Everything is licensed under the GNU AGPL license, version 3. I chose this license so that the tracker could stay open-source forever.
Spaghet-o-meter:
I can’t put the spaghet-o-meter in the readme file (that’d look unprofessional), so it’s moving here.
track.easterbunny.cc Spaghet-o-meter: 10/10
Geo API Spaghet-o-meter: 2/10
Twitter Bot Spaghet-o-meter: 5/10
Route Compiler Spaghet-o-meter: 7/10
More description about the Spaghet-o-meter is coming soon.
An addendum:
There is ought to be a few people after reading this article thinking to themselves, “Wow this dude is gonna do so far in life and is so much better than anything I could ever do”, or “Wow this dude’s creations are like so much better than anything I could ever make”.
Please take a moment to read this quote.
“Remember to look up at the stars and not down at your feet. Try to make sense of what you see and wonder about what makes the universe exist. Be curious. And however difficult life may seem, there is always something you can do and succeed at.
It matters that you don’t just give up.” – Stephen Hawking
