This project has a visual representation available on my Portfolio.
TL;DR: I made a full-stack Flask app that tracks how my local power provider is doing over the past 2 days with outages.
Power outages suck, and my local power company does a fine job at it. But, still, I always had a vision of a website that tracked how well they were doing with outages and customers out – and a graph for a visual representation.
I was sitting on this idea for about a year or so, and after about 30 hours of coding, the dream came true!
CenHud Outage Trends, or as I refer to it, chtrends, is a pretty simple program. There’s two components that I’ll cover here.
First up is the cron script that collects data on each 10-minute interval from Central Hudson’s outage page. When I first made this script, I thought I could load in the outage page, use BeautifulSoup4 to parse it, and get the outage and customers out counter. Bada bing bada boom we’re done, I can go home now.
But no no no! Power companies just have to design their power outage portals in the shittest way possible.
Instead, you have to query an S3 bucket with the outage data. Don’t believe me? Here’s the code!
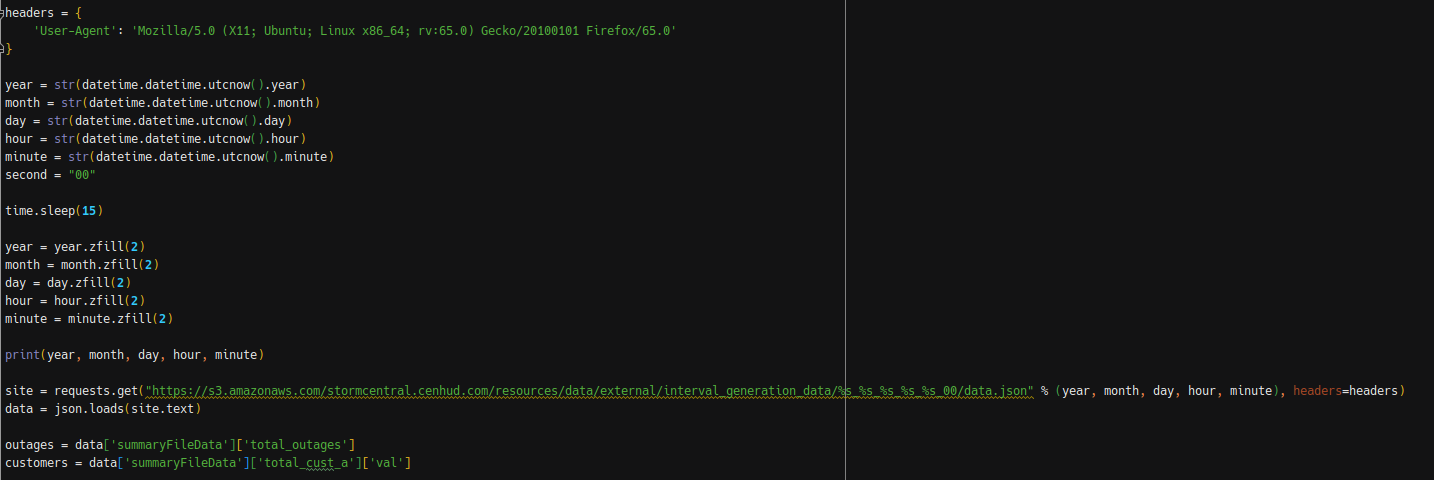
As a quick example, if I wanted to query the outage data for 2:00 PM EDT on September 3, 2019, I’d have to query s3.amazonaws.com/stormcentral.cenhud.com/resources/data/external/interval_generation_data/2019_09_03_18_00/data.json, which returns a JSON file with the outage numbers. Again, it’s stupid.
Additionally – the data doesn’t become available until about 5-10 seconds after the top of every 10-minute interval, so I sleep for 15 seconds after collecting the time data. Seconds also must always be zero, and everything has to be 0-padded if need be. That’s power outage systems for you!
Regardless, the script parses the JSON data, and then feeds it into DynamoDB, while also deleting data that’s over 2 days old. The deleting process is encased in a try/catch block, so that if the database just was created, the script doesn’t error out.
The second part of this system is the flask server that powers everything. The flask server will get all data from Dynamo on request, then do parsing to figure out trends, records, and all that fun jazz. One flaw with the system in the beginning was if you requested data at the very top of the hour, there wouldn’t be any data – since there’s the 15-second delay in the script getting the data.
To get around this, if a request comes in before the most recent data is available, the flask server falls back on the old data (e.g. if you requested at 2:00 PM, data from 1:50 PM would be loaded). Trend data is collected with the most recent 10-minute interval as the reference point, regardless of if the old data fallback is triggered. (e.g. For that 2:00 PM request, even if the current outage data is using 1:50 PM data, the trend data reference point is still 2:00 PM).
For trend data, I also had to work around more issues. One priority was having an English definition of whether outages/customers out was up or down – easy enough. However, there are edge cases were the trend percentage can be infinity, usually when the outage count jumps from 0 to anything above 0 ((2 – 0) / 0 = NaN). If this happens, the flask server catches the error, and instead puts Up Infinity% as the trend data.
Additionally, and more generally as a limitation of math in general, the Down percentage will max out at 100%, but the Up percentage will go as high as it pleases. I’ve seen over 10,000% up in some cases, which is pretty funny.
Of course, more issues galore on the actual webpage side. For Google Charts, I had trouble doing Dual-Y graphs so that the vertical grid-lines could match up. To solve this issue, there’s a Chart Type selector so you can see Customers Out & Outage combined, or either alone in a separate chart. Easy enough, just some on-click JavaScript magic, and the chart drawing function being able to figure out which type of chart to draw.
To get all of this data into the webpage, the actual site source code is a Jinja2 template. The flask server will fill in the variables, and that’s that. To get data in for google charts, I did have to indicate that the “dict” variable had to be a raw dictionary – by default the Jinja2 interpreter will convert everything to a string.
One more interesting tidbit. Safari’s Date() support is super weird – it won’t accept the Y-M-D H:M:S (e.g. 2019-09-03 12:00:00) format. Of course, the system stores data in this format, so a slight issue there. Even weirder? Y/M/S H:M:S (e.g. 2019/09/03 12:00:00 ) works. Google Charts would then refuse to work, since it needs Date() to work for the nice time-based graphs. Simple fix though, I just replace the - character with /.
Welcome to the wonderful world of being a web developer!
Anyhow, after all this trouble, I finally did get the outage trend tracker to work. And…it works great! At first the data retention period was 1 day, but it’s now been set to 2 days. The trend tracker did go through a major thunderstorm, and it worked like a champ.
In 2020, I decided to improve upon the outage tracker by changing the architecture for data storage to UNIX timestamps, instead of fully formatted dates. The logic behind this is pretty simple. When the US goes in and out of DST, the outage trends page would get pretty confused, and was unable to properly delete data.
Over the course of about 5-10 hours, I patched up the trends page so that it could run on UNIX timestamps, rather than fully formatted dates. Of course, this made the code an absolute mess!
After the switch to UNIX timestamps, there were some lingering issues with the outage trend tracker for some time, but I was able to patch the issues as they occurred. Mostly, it was oversights in making the change from formatted dates to unix timestamps.
CenHud Outage Trends is one of my favorite projects, but also one of my most poorly coded projects! It’s badly in need of a rewrite. If I have the free time at some point, I’ll consider doing just that. In the mean time, it does the job pretty well, and it’s pretty stable.
You can visit the website here: https://chtrends.owenthe.dev
You can view the source code for CH Outage Trends (licensed under GNU AGPL v3) here: https://gitlab.com/o355/chtrends
